Chi Square Calculator: Run Goodness of Fit and Independence Tests Online
Run chi-square goodness-of-fit and independence tests in your browser — the Chi Square Calculator computes the χ² statistic, p-value, degrees of freedom, critical value, standardized residuals, and Cramér's V from any contingency table.
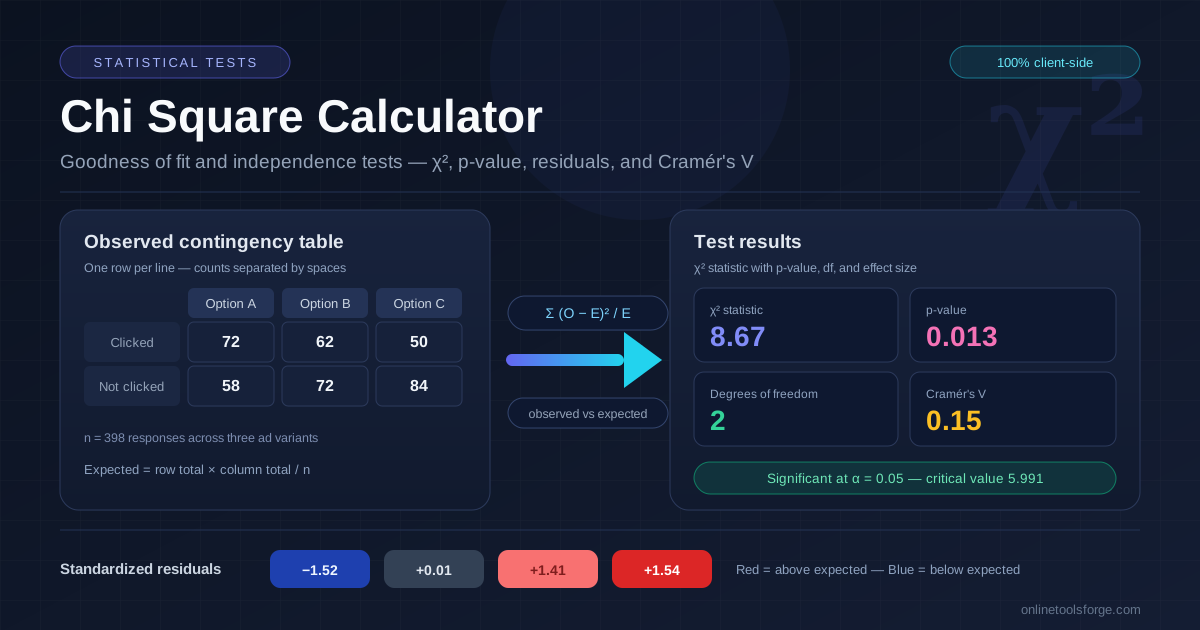
Table of Contents
Chi Square Calculator: Run Goodness of Fit and Independence Tests Online
Not every analytics question is about averages. Much of the data you handle is categorical: clicks versus impressions, yes versus no responses, one brand chosen over another. Comparing means is the wrong lens for counts — this is a job for chi-square. The Chi Square Calculator runs both classic variants — goodness of fit and the test of independence — entirely in your browser, with no signup and no data leaving your machine.
Enter your observed counts and it returns the χ² statistic, p-value, degrees of freedom, critical value, standardized residuals showing which cells deviate most, and Cramér's V to size the effect. This guide covers when to use each test and how to read every number it produces.
Why Use Chi Square Calculator?
- Two tests in one place. Switch between goodness of fit and independence modes without changing tools.
- More than a verdict. Alongside the p-value you get the critical value, standardized residuals, and Cramér's V, so you can explain the result, not just report it.
- Your alpha, your call. Choose 0.01, 0.05, or 0.1 and the conclusion updates against the matching χ² distribution.
- Familiar input. Paste counts one row per line, separated by spaces, with optional expected proportions for goodness of fit.
- Built-in health checks. Flags expected counts below 5, ragged tables, and zero rows or columns before they silently distort the result.
- Private by design. Every computation happens client-side in JavaScript — nothing is uploaded, stored, or logged.
Key Features
| Output | What it tells you |
|---|---|
| χ² statistic | The total squared gap between observed and expected counts |
| p-value | The chance of a gap this large if the null hypothesis were true |
| Degrees of freedom | Which χ² distribution your statistic is judged against |
| Critical value | The threshold your χ² must exceed to reject at your alpha |
| Standardized residuals | Which individual cells drive the overall result |
| Cramér's V | Effect size for independence tests, from 0 (none) toward 1 (perfect) |
- Goodness-of-fit mode accepts optional weights, so you can test against any theoretical distribution.
- The conclusion line states the decision outright — handy when pasting results into a report.
- Uneven rows and all-zero margins are caught with specific messages instead of a broken calculation.
How to Use
- Pick the test type. Goodness of fit for one categorical variable, independence for a contingency table of two variables.
- Enter observed counts. Goodness of fit takes one line of counts; independence takes one row per line, counts separated by spaces, with optional weights.
- Choose the significance level. Alpha 0.05 is the default; 0.01 is stricter, 0.1 looser and exploratory.
- Run the test. The χ² statistic, degrees of freedom, p-value, and critical value appear immediately, with a plain-language conclusion.
- Read the diagnostics. Inspect standardized residuals for the cells that matter, check Cramér's V for effect size, and heed any low-expected-count warning.
Goodness of Fit vs Independence
Two questions, one statistic
Both tests run on the same χ² machinery but answer different questions. Goodness of fit asks whether the distribution of one categorical variable matches an expectation — are four support-ticket categories equally likely? Independence asks whether two categorical variables are related.
Observed versus expected counts
Each observed count (O) is compared against an expected count (E). For goodness of fit, E is n times the category's expected proportion. For independence, E is the row total times the column total divided by the grand total. The statistic sums (O − E)² / E across all cells: squaring stops over- and under-counts from canceling, and dividing by E puts cells on the same footing — a shortfall of 10 against an expectation of 15 counts far more than one against 1,000.
Degrees of freedom
Degrees of freedom encode the shape of your table: categories minus one for goodness of fit, (rows − 1) × (columns − 1) for independence. They select the reference χ² distribution, which is why a χ² of 8 is unremarkable with df = 5 but decisive with df = 1.
Standardized residuals: which cell drives the result
A significant χ² says something differs, not what. The standardized residual for each cell, (O − E) / √E, answers the follow-up: values beyond roughly ±2 mark the cells contributing most. If a test across three ad variants is significant and one variant shows a residual of +1.9, you have found the over-performer.
Cramér's V: how strong is the association
With large samples, trivial gaps turn significant. Cramér's V, reported for independence tests, rescales χ² to run from 0 (no association) toward 1 (a perfect one): roughly 0.1 is small, 0.3 moderate, and 0.5 or more strong for a 2 × 2 table. Quoting it beside the p-value keeps the headline honest.
A worked 2 × 2 example
An A/B test sends 200 visitors to each of two landing pages: the old page converts 48 and misses 152, the new page converts 74 and misses 126. With n = 400 and 122 total converters, each expected count is 200 × 122 / 400 = 61 for converters and 139 for non-converters. Then χ² = (48−61)²/61 + (152−139)²/139 + (74−61)²/61 + (126−139)²/139 ≈ 7.97. With df = (2−1)(2−1) = 1, the critical value at α = 0.05 is 3.841 and the p-value is about 0.005: the new page genuinely converts better. Note that Cramér's V ≈ 0.14 — a real but modest lift.
The small-count caveat
The χ² distribution is an approximation that misbehaves when expected counts are small. The rule of thumb: every expected count should be at least 5. The calculator flags violations so you can merge sparse categories or gather more data first; for tiny 2 × 2 tables, Fisher's exact test is the classical alternative.
Practical Use Cases
Survey and market research
Test whether the distribution of responses (satisfied, neutral, dissatisfied) matches a benchmark, or whether attitude is independent of demographics such as age bracket or region.
A/B tests with categorical outcomes
Conversions, sign-ups, bounce categories, and plan selections are counts, not means. Lay the variants out as rows and the outcomes as columns; the independence test tells you whether the differences you see are signal or noise.
Dice, RNG, and fairness checks
Roll a die 600 times and a fair one should produce about 100 of each face — a textbook goodness-of-fit test against a uniform expectation. The same check audits random number generators, weighted loot tables, or any system claiming to be even-handed.
Demographic and operational comparisons
Does subscription plan differ by country? Do defect counts differ across factories or shifts? Whenever two categorical factors meet in a table, chi-square is the fastest honest answer — and the residuals point at the segment to inspect.
Best Practices
- Check expected counts before trusting the verdict. If any expected count falls below 5, merge categories or collect more data first.
- Report residuals, not just the verdict. A significant p-value without residuals hides where the effect lives; lead with the cells that deviate.
- Pair significance with effect size. Quote Cramér's V next to the p-value so readers know whether the association is worth acting on.
- Enter raw counts, never percentages. The math depends on sample size; proportions discard the denominators the test needs.
- Keep observations independent. Each subject should contribute to exactly one cell; repeated measures call for different methods.
- Plan the sample before the test. Chi-square tests on tiny tables are underpowered; size the study up front.
Ready to Test Your Categories?
If you have counts sitting in a spreadsheet, you are one paste away from an answer. Open the Chi Square Calculator, drop in your table, pick an alpha, and get the χ² statistic, p-value, residuals, and effect size in seconds — free, private, and right in your browser.
Related Tools You Might Like:
- T-Test Calculator — compare the means of continuous measurements.
- Statistics Calculator — compute descriptive statistics and explore your data before hypothesis testing.
- Sample Size Calculator — plan how many observations your test needs before you collect them.
May your residuals stay small and your insights stay sharp.
Frequently Asked Questions
Q: When should I use a chi-square test instead of a t-test?
A: Use chi-square when your data are counts in categories — yes/no outcomes, choices, group memberships. A t-test compares means of continuous measurements.
Q: What exactly does the p-value mean here?
A: It is the probability of seeing a χ² statistic at least this large if the null hypothesis (no difference from expectation, or no association) were true.
Q: Why does an expected count below 5 matter?
A: The p-value relies on a χ² approximation that becomes inaccurate with sparse cells, so results can flip by accident. Merge sparse categories, collect more observations, and watch for the tool's warning.
Q: Can I analyze tables larger than 2 × 2?
A: Yes. Paste any table with consistent row lengths; degrees of freedom become (rows − 1) × (columns − 1) automatically, with residuals and Cramér's V for every cell.
Q: Is my data sent to a server?
A: No. All computation runs client-side in your browser; your contingency table never leaves your device.