FIRE Calculator: Map Your Years to Financial Independence
Estimate your years to financial independence with the FIRE calculator, which turns annual expenses, savings rate, and current savings into a FIRE number, milestones, and a year-by-year projection under the 4% rule.
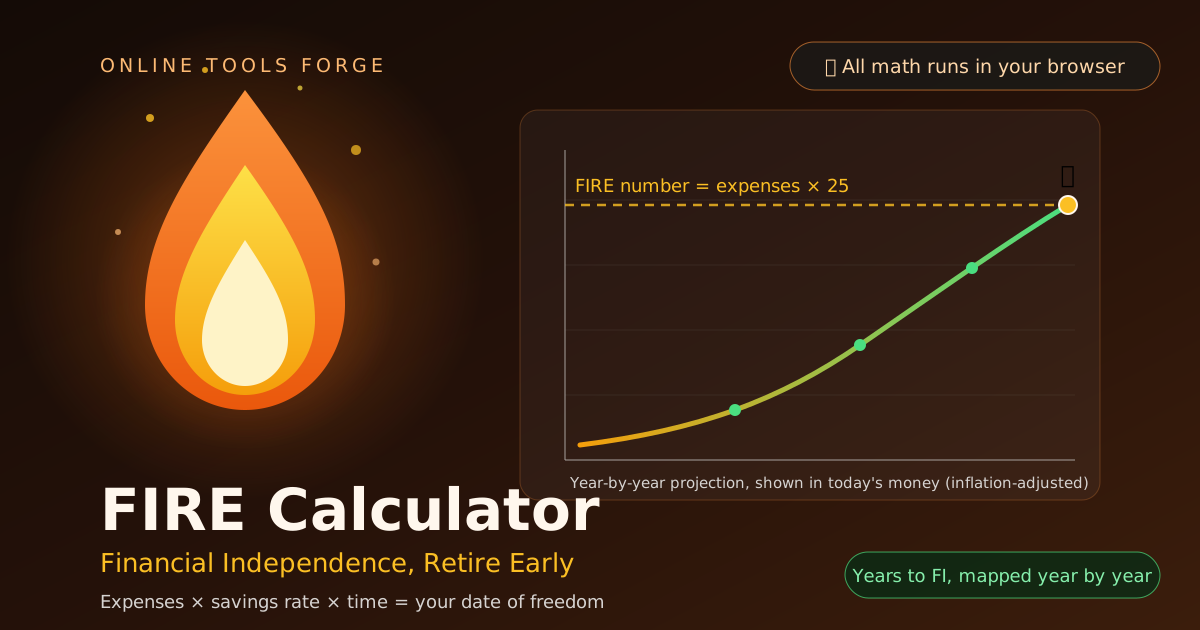
Table of Contents
FIRE Calculator: Map Your Years to Financial Independence
Financial independence is not a lottery win but a mechanical relationship between what you spend, what you save, and how long compounding works — yet most people never see that math for their own numbers.
The FIRE calculator, built on the FIRE movement's framework (Financial Independence, Retire Early), fixes that. Enter annual expenses, age, savings, savings rate, gross income, and expected real return, and it answers the key question: how many years until your portfolio supports you without a paycheck? It computes your FIRE number under the 4% rule, shows your target age, marks milestones, and builds a year-by-year projection table.
Everything runs client-side — no accounts, and no financial data leaves your browser. This guide covers usage, the math, and scenarios you can adapt today.
Why Use the FIRE Calculator?
- It turns a vague dream into a date. "Someday" becomes "FI in roughly 19 years" — a target age motivates far more than an abstract dollar amount.
- It exposes the power of your savings rate. The tool makes it obvious that your savings rate, not market returns, is the biggest lever you control.
- It anchors the plan to your real lifestyle. Because the FIRE number derives from your annual expenses, the target reflects the life you actually want, frugal or comfortable.
- It works in inflation-adjusted dollars. Projections use a real (after-inflation) return, so results appear in today's purchasing power.
- It is free, instant, and private. Results update as you type, and the math stays on your device.
Key Features
| Input or Output | What It Tells You |
|---|---|
| Annual expenses | What your nest egg must sustain — the biggest driver of your FIRE number |
| Current age and savings | Your starting point today and how old you will be at the finish line |
| Savings rate and gross income | The share of income invested yearly — the engine of the projection |
| Expected real return | Portfolio growth after inflation (default 5%), keeping results in today's dollars |
| Safe withdrawal rate | The share you can spend yearly in retirement (default 4%) |
| FIRE number and target age | Headline results: expenses × 25 under the 4% rule, plus your FI date |
| Milestones and projection table | Year-by-year breakdown of your balance approaching each milestone |
- Instant recalculation. Nudge the savings rate and watch years-to-FI move in real time.
- Adjustable withdrawal rate. Set 3.5% instead of 4% and see how much more a conservative margin demands.
How to Use
- Enter your annual expenses — what you realistically expect to spend in retirement, starting from current spending.
- Fill in your current age and savings so the calculator reports your target FI age and credits your head start.
- Enter gross income and savings rate honestly. If you earn 80,000 and truly invest 24,000, enter 30% — the projection is only as good as its inputs.
- Review the assumptions. The 5% return and 4% withdrawal defaults are sensible baselines; adjust if you plan more conservatively.
- Read the results: FIRE number, years to FI, and target age — then scan the projection table for each milestone.
Understanding the Concepts
The 4% rule and the 25× shortcut. Historical analyses of US stock and bond returns (the Trinity study) found that withdrawing 4% in year one, inflation-adjusted annually, survived nearly every 30-year period on record. Inverted: your FI number is 25 times annual expenses. Spend 40,000 a year and you need 1,000,000. Cutting expenses shrinks the target and frees money to invest.
Real returns keep the math honest. The calculator works in real terms: earn 8% nominally while inflation runs 3% and your real return is roughly 5%, with every table figure in today's purchasing power. Entering nominal returns makes FI look years closer than it is.
The savings rate dominates. Years to FI depend far more on the gap between income and spending than on market performance. At typical real returns a 10% saver needs about half a century, a 50% saver roughly 17 years, and a 65% saver barely a decade — hence the obsession with expenses, the denominator.
The FIRE spectrum. Lean FIRE means a minimal budget (30,000 a year), dropping the target to 750,000. Fat FIRE upgrades your lifestyle (80,000+), pushing toward 2,000,000. Coast FIRE means savings alone will compound to your number by normal retirement age; you only cover living costs. Barista FIRE sits between: a smaller nest egg plus part-time income fills most of the gap. The calculator handles all four via the expense input — or by checking whether savings already compound fast enough for Coast.
Practical Use Cases
The Early-Career Aggressive Saver
Maya is 28, spends 32,000 yearly, earns 70,000, and invests 24,500 (35% savings rate). Her FIRE number: 32,000 × 25 = 800,000, with 15,000 already saved. At 5% real the projection is roughly 19 years to FI — independent around age 47, passing 25% of the goal in year 6 and 50% near year 11.
Raising the Savings Rate to Buy Back Years
Dev is 40 with 120,000 saved. Spending 60,000 sets a 1,500,000 target; saving 22,000 of his 110,000 income (20%) leaves FI about 25 years away, near age 65. Raising the rate to 40% doubles investing to 44,000 yearly, and the projection drops to roughly 18 years — FI near 58, nearly eight years reclaimed by one change.
Testing a Coast FIRE Plan
Lena is 30 with 50,000 invested and wonders if she can stop saving. Targeting 1,000,000 by 65, her 50,000 grows to only about 276,000 at 5% real — a quarter of the way. Coast-ready today requires about 181,000 invested (1,000,000 ÷ 1.05³⁵).
Right-Sizing with Lean and Barista FIRE
The same household produces wildly different numbers by lifestyle: spending 30,000 implies 750,000; spending 80,000 implies 2,000,000. Someone spending 40,000 who earns 16,000 reliably part-time needs the portfolio to cover only 24,000: a Barista number of 600,000 instead of 1,000,000 — 40% smaller. Variants take seconds to test.
Best Practices
- Use after-tax reality: enter what truly leaves your account and what you truly invest — optimism inflates everything.
- Revisit the calculator quarterly. Income changes, families grow — regular checks keep the plan alive.
- Pair it with companion tools. Map short-term targets with the savings goal calculator and stress-test returns with the compound interest calculator.
- Treat 4% as a starting point, not gospel. Early retirees face longer horizons; many plan around 3.25–3.5% or keep a flexible spending buffer.
- Automate the prescribed rate. Payday transfers convert the math into behavior.
- Aim to be roughly right, then adjust. Markets never follow a smooth 5% line; direction matters more than decimal precision.
Start Counting Down to Freedom Today
Open the FIRE calculator, enter six honest numbers, and see your FIRE number, target age, and every milestone. Excited? Protect the plan. Unsettled? You now know which lever — expenses, savings rate, or timeline — to pull first. Either way, you are now playing with the score visible.
Related Tools You Might Like:
- Compound Interest Calculator — see reinvested growth accelerate your path to the FIRE number
- Savings Goal Calculator — plan the monthly contributions needed for each milestone
- Retirement Calculator — model conventional retirement income alongside your FIRE plan
Happy calculating!
Frequently Asked Questions
Q: What exactly is a FIRE number?
A: The portfolio that lets you live off withdrawals indefinitely: 25 times annual expenses under the 4% rule. Spending 40,000 yearly requires 1,000,000; 32,000 requires 800,000.
Q: Why does the calculator use 4% as the safe withdrawal rate?
A: Historical studies show a 4% withdrawal, inflation-adjusted thereafter, survived nearly every 30-year retirement on record. A tested heuristic, not a guarantee — hence the adjustable rate.
Q: Are results shown in future dollars or today's dollars?
A: Today's dollars. A real return (growth minus inflation, 5% by default) is applied, so every figure reflects inflation and represents current purchasing power. Never enter nominal returns.
Q: My projection says 25+ years — how do I shorten it fastest?
A: Raise your savings rate: more invested yearly, and a smaller FIRE number if funded by spending cuts. Moving from 20% to 40% routinely removes a decade.