Log Viewer: Paste, Filter and Cluster Your Logs Right in the Browser
Log Viewer lets you paste NDJSON, logfmt or plain-text logs and explore them in your browser with level filters, level-stat bars and error clustering — no uploads, no setup.
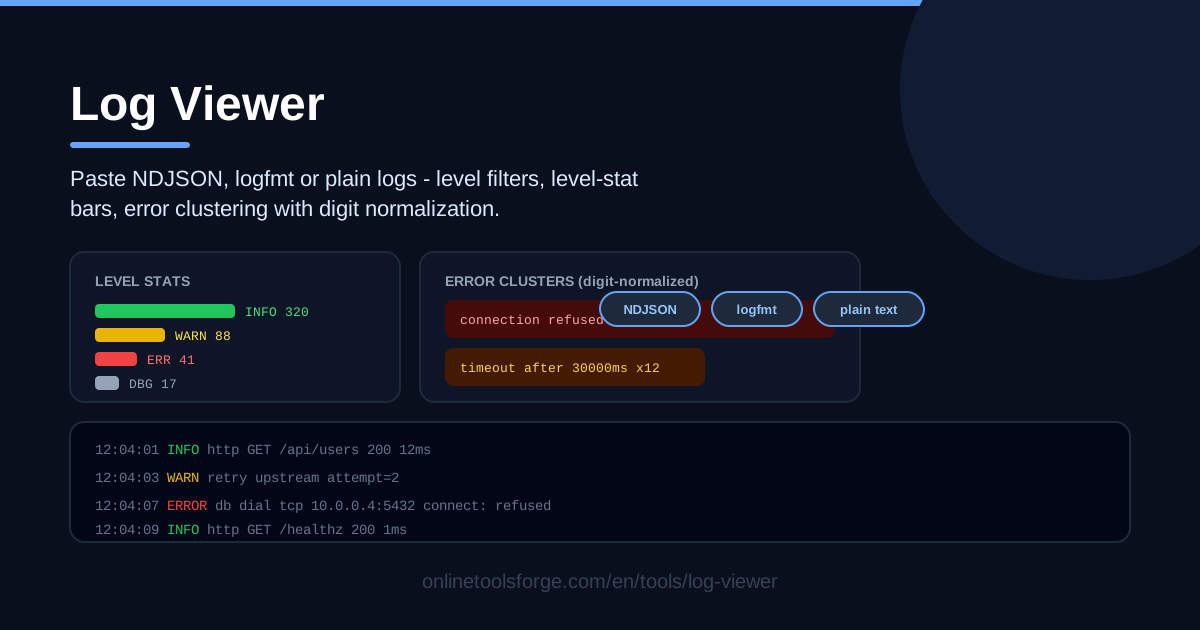
Table of Contents
Every debugging session eventually lands in the same place: a wall of log output and a question. Is this one failure repeated a thousand times, or a thousand different failures? The Log Viewer is built for exactly that moment. Paste your logs — NDJSON, logfmt, or plain text — and explore them immediately in the browser with level filters, level-stat bars, and error clustering that collapses near-identical lines into a handful of patterns.
What makes it different is what it leaves out: no upload, no account, no pipeline to configure. Everything runs in your browser, so your logs never leave your machine.
Here is what the tool does, how to use it, and where it fits next to heavier observability platforms.
Why Use Log Viewer?
- Paste-and-look, nothing to install. Inspecting logs should not require provisioning anything. Copy your output, paste it in, and read a structured, filterable view within seconds — all locally in your browser.
- It speaks the formats you already have. Modern services emit NDJSON, Go binaries often log in logfmt, and old cron scripts just print lines. The tool detects the format and parses it so you can filter and group instead of squinting.
- Level-stat bars give instant shape. Before reading a single line, you see how many INFO, WARN, ERROR and DEBUG entries you pasted. A log that is 90% errors reads very differently from one that is 99% routine with a few exceptions buried inside.
- Error clustering cuts repetition down. "Connection refused on port 5432" and "Connection refused on port 5433" are the same failure with different numbers. Digit normalization collapses them into one cluster, so you count root causes, not lines.
- Two filters cover most questions. Filter by level (INFO/WARN/ERROR/DEBUG) to find what matters, then narrow with a free-text filter for a service name, endpoint, or message fragment.
- Privacy by architecture. Parsing, filtering and clustering all happen locally, so you can inspect logs containing customer data, internal hostnames or stack traces without sending them anywhere.
Key Features
| Feature | What it does |
|---|---|
| Multi-format parsing | Accepts NDJSON, logfmt and plain-text logs; the format is detected from what you paste |
| Level filter | Show or hide entries by severity: INFO, WARN, ERROR or DEBUG |
| Free-text filter | Narrow the view with any keyword, from service names to message fragments |
| Level-stat bars | Entry counts per level at a glance, so the shape of the log is visible immediately |
| Error clustering | Groups similar error messages into clusters using digit normalization |
| Scrollable entry view | Browse long output comfortably in a terminal-style, scrollable list |
A few details worth knowing:
- Digit normalization is the heart of clustering. Digit runs in an error message become placeholders before grouping, so "request 123 failed" and "request 456 failed" collapse into one pattern with a count — "500 error lines" becomes "3 distinct errors, one happening 470 times."
- The filters compose. Filter to ERROR first, then search for "timeout" within just those errors; the level-stat bars update as you narrow, so you always know how much you are looking at.
- Plain text still gets structure. Even without NDJSON or logfmt, your paste becomes a list you can filter, count and cluster rather than a blob you scroll through.
How to Use Log Viewer
- Paste your logs. NDJSON (one JSON object per line), logfmt (space-separated key=value pairs), and plain-text lines all work — a kubectl logs dump, a CI job's stderr, or a file tail.
- Confirm the format detection. The tool detects the format automatically. Glance at the parsed entries to check they split cleanly per line; mixed sources fall back to a filterable plain-text list.
- Filter by level. Start with ERROR during an incident; add WARN and DEBUG when you need the lead-up to the failure. The level-stat bars show the counts behind each choice.
- Search with the text filter. Type a keyword — a service name, an HTTP status, a table name. ERROR-only plus one keyword usually isolates the signal in a thousand-line paste.
- Drill into the error clusters. The largest cluster is usually the root cause; small ones are the interesting long tail. Open the underlying entries in the scrollable view for the exact lines.
From Noise to Clusters
The design follows one idea: a log paste is not text, it is data waiting for structure. NDJSON is the richest format — each line is a full object, so fields like level, timestamp and message can be read directly. Logfmt is leaner — level=error msg="connection refused" port=5432 — but still structured through key=value pairs. Plain text is the lowest common denominator: it carries whatever the emitting program printed, with no machine-readable level guaranteed. A good viewer meets each format where it is instead of demanding conversion first.
Once entries are structured, the level-stat bars answer the first question anyone asks of a log dump: what does this look like? A tall ERROR bar beside a modest INFO bar means an incident; a long flat DEBUG tail with one lone WARN usually means a normal run. It is a one-second sanity check that shapes everything after it.
Then comes clustering, and digit normalization is what makes it work at scale. Raw message text is a poor grouping key: "user 4821 login failed" and "user 9317 login failed" are different strings that are operationally identical. Replacing every digit run with a placeholder before grouping collapses the variants into one pattern. That is also why "port 5432" and "port 5433" merge: if every database in the pool refuses connections, that is one problem, not twenty.
Clustering is a lens, not an oracle. Two genuinely different failures can normalize to the same shape — "disk 0 full" and "disk 1 full" are different disks, and one filling is not all of them. Conversely, a variable that matters ("retries remaining: 3" versus "retries remaining: 0") can hide inside a single cluster. Read a cluster count as "how many lines look like this," then open the actual entries and confirm the pattern means what you think it means.
Practical Use Cases
Triage a Failed Deploy from kubectl Logs Output
When a deploy goes red, paste kubectl logs deploy/my-service --previous into Log Viewer instead of scrolling a terminal. The level-stat bars tell you within seconds whether the crash is a flood of one error or a ramp of different failures, and clusters group panic messages by normalized pattern. If one cluster holds 90% of the errors, you have your root cause before the second minute of the incident.
Scan a Cron Job's Output
Cron jobs are the forgotten logs of most systems — output vanishes into mail or a file nobody tails. Next time a nightly job misbehaves, paste the captured output in. Filtering to WARN and ERROR strips routine progress lines, and clustering shows whether the job hit one failure a hundred times or a hundred failures once — the difference between a flaky dependency and a broken job.
Share a Sanitized Snippet in Code Review
Reviewers cannot debug what they cannot see, but raw production logs — user IDs, tokens, internal hostnames — do not belong in a pull request. Because the tool runs entirely in your browser, paste the full output, filter to the relevant ERROR lines, and copy out only the entries that matter, sanitized as needed. Your reviewer gets the pattern and the proof without the payload.
Quick Checks Without Wiring a Log Platform
Not every environment deserves a logging stack. A side project, a home Raspberry Pi, a staging box for a client demo — sometimes the total log output is one file. Full observability is overkill; paste-and-look is exactly right. It is also the answer when the logs you need come from a system that does not ship to your platform yet.
Best Practices
- Sanitize secrets before logs travel anywhere. The tool runs locally, but the moment you copy from it into an issue or a PR you are moving logs again. Strip tokens, passwords, session IDs and personal data first.
- Filter to ERROR first, widen only if you must. Confirm the ERROR-only picture before adding WARN or DEBUG for context.
- Use clusters to size the blast radius. A cluster of 2 and a cluster of 2,000 demand different responses, even when the message is identical.
- Keep timestamps visible when drilling in. Check whether a suspicious cluster spans hours or bunches into one minute — that often separates a systemic fault from a one-off.
- Treat cluster counts as a starting point. Digit normalization sometimes merges genuinely different things; open a cluster and confirm its entries match the pattern label.
- Verify format detection on mixed sources. If your paste mixes JSON lines with stack traces, confirm the parse split where you expect and lean on the text filter for the rest.
Ready to turn your next wall of log output into a short list of patterns? Open the Log Viewer, paste your logs, and start at the ERROR bar — your root cause is probably already sitting in the biggest cluster.
Related Tools You Might Like:
- Nginx Log Analyzer — dig into access and error logs from your web server
- JSON Formatter — pretty-print and validate the JSON payloads hiding inside your logs
- Cron Parser — decode and verify the schedules behind your cron job logs
Happy debugging!
Frequently Asked Questions
Q: Does Log Viewer upload my logs anywhere? A: No. Parsing, filtering, level statistics and error clustering all run in your browser. The log text you paste never leaves your machine.
Q: Which log formats does it support? A: NDJSON (one JSON object per line), logfmt (space-separated key=value pairs), and plain-text lines. The format is detected automatically, and plain text still becomes filterable, clusterable entries.
Q: How does error clustering treat different numbers in messages? A: Runs of digits are replaced with placeholders before grouping, so "connection refused on port 5432" and "connection refused on port 5433" collapse into one cluster. Note that this can also merge genuinely distinct failures that differ only by a number.
Q: Can it handle very large log files? A: It is designed for pastes — a failing deploy's output, a cron run, a recent service log tail — rather than gigabyte-scale archives. For large dumps, paste a relevant window and filter from there.