Nginx Log Analyzer: Read Access Logs Like an Incident Responder
Paste nginx or Apache access logs to get a status-code breakdown, top IPs, top endpoints, bandwidth totals, and traffic-spike alerts — analyzed 100% client-side with Nginx Log Analyzer.
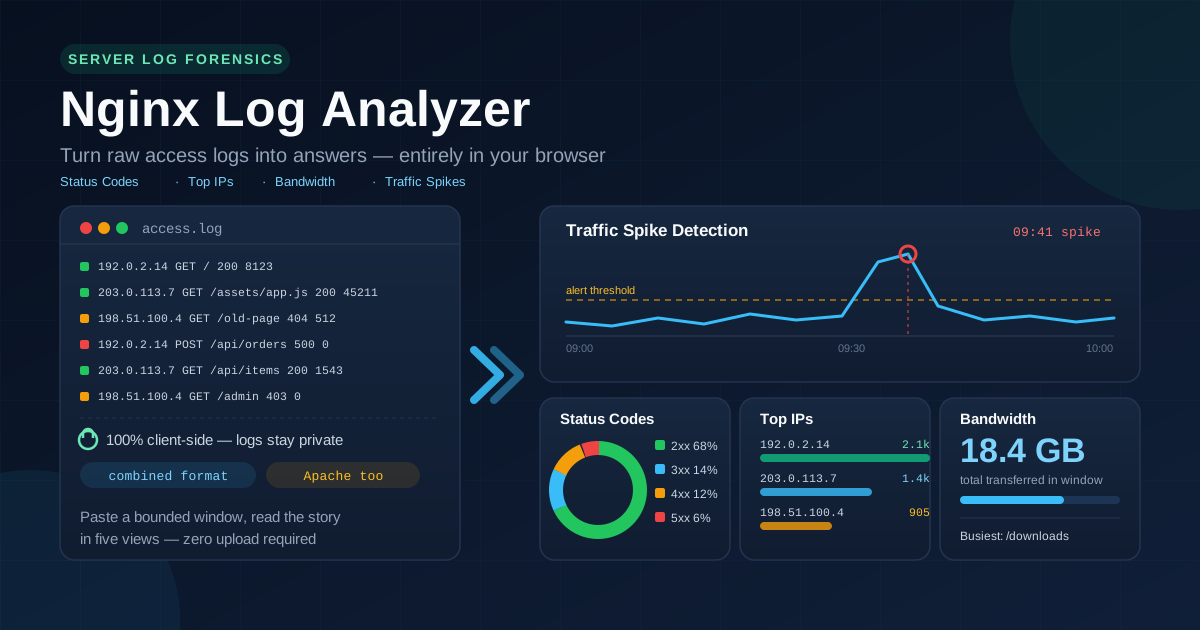
Table of Contents
Nginx Log Analyzer: Read Access Logs Like an Incident Responder
Every web server runs a flight recorder: the access log, noting every request — who asked, for what, when, and how the server answered. When a site breaks, slows, or comes under attack, that file is the first witness to interview. The Nginx Log Analyzer turns the raw text into a status-code breakdown, top IP and endpoint rankings, bandwidth totals, and traffic-spike alerts within seconds of pasting.
But there is a catch. Access logs are packed with customer IP addresses, visited URLs, and user agents. Uploading the file to a random converter ships your users' personal data to a server you do not control.
This analyzer therefore works entirely in your browser: paste the extract, read the insights, close the tab — nothing was ever transmitted anywhere.
Why Use Nginx Log Analyzer?
- Privacy-first, local analysis. Parsing runs 100% client-side. Real logs contain your users' IP addresses and browsing paths — here they never leave your machine, safe even for production and compliance-sensitive environments.
- No setup, no pipeline. No SSH session, no grep incantations, no log shipping stack — a browser is all you need, on any operating system.
- Speaks both dialects. Nginx combined format and Apache common and combined formats are detected automatically, so mixed environments need no second tool.
- Answers, not just filtered lines. Aggregation instead of more text: a five-thousand-line file becomes one glanceable dashboard of status codes, top IPs, endpoints, and bandwidth.
- Spots trouble you would scroll past. Traffic-spike detection flags the minutes where volume jumped abnormally — the signature of a scraper, a retry storm, or an attack.
- Fast enough for an incident. Minutes matter during an outage: paste the last thirty, read the verdict, act.
Key Features
| Feature | What It Shows |
|---|---|
| Status-code breakdown | Counts for 2xx, 3xx, 4xx, and 5xx — success, redirects, client and server errors |
| Top IPs | Client addresses generating the most requests, ranked |
| Top endpoints | URLs hit most often, so hot spots surface immediately |
| Bandwidth totals | Bytes served across the pasted window — the weight your server carried |
| Traffic-spike detection | Time buckets where volume jumps abnormally, marking candidate incidents |
| Client-side parsing | Everything runs in your browser; no upload, no storage, no account |
Worth knowing:
- Mixed formats are fine. Paste nginx and Apache lines together; malformed lines are skipped instead of failing the parse.
- Paste, not plumbing. No server-side integration — copy the window you care about and get back to fixing.
How to Use
- Extract a bounded window. On the server, pull the slice you care about — say the last hour around an incident — from your rotation files or a simple tail of the access log.
- Open the analyzer. Visit Nginx Log Analyzer and paste the lines into the input area; mixed nginx and Apache formats are detected automatically.
- Read the status-code breakdown first. A healthy site is mostly 2xx. A wall of 4xx means broken links or probing; rising 5xx means a server-side failure.
- Check top IPs and top endpoints. One address hammering one endpoint is rarely a human — these rankings usually name the scraper or the broken page in seconds.
- Follow the spikes and bandwidth. Match flagged spike times against your deploy log, and use the bandwidth total to judge caching wins or a hot asset. Fix the cause, not the symptom.
Reading an Access Log Like an Incident Responder
The anatomy of a combined-format line. A typical nginx line decomposes into eight fields read in order: client IP (who), identity (almost always a dash), authenticated user (usually a dash too), timestamp (when), the request line such as GET /index.html HTTP/1.1 (what), status code (how the server answered), bytes sent (how heavy the answer was), and referer plus user agent (where from, with what client). Apache logs carry the same fields with different punctuation; name them once and any line becomes a sentence.
What each aggregated view reveals. The status-code breakdown is your first triage: a burst of 404s usually means broken references after a deploy, 401s and 403s mean expired sessions or probing of admin paths, and 5xx mean your application failed while nginx was still alive. The top-IP ranking exposes scrapers and one-sided load; the top-endpoint ranking shows where the pain concentrates. Bandwidth totals settle caching arguments: if three assets dominate the bytes served, fixing those three beats abstract tuning.
Traffic-spike detection is the tripwire. Humans browse in smooth curves; scripts do not. When volume in one minute jumps well above the surrounding window, the tool flags it — and that is where incidents hide: a scraper finding your product listing, a retry storm, or the opening move of credential stuffing. A 4xx or 5xx spike arriving with the volume jump is the loudest signal an access log can give you.
A worked mini-log walkthrough. You paste thirty minutes and see: 71% of responses are 200, 24% are 500, 3% are 404; the top IP is 198.51.100.4 with 4,100 requests; the top endpoint is POST /api/checkout with 4,090 of them; the spike detector flags 09:40 to 09:44. Read it as a sentence: starting at 09:40, one client hammered your checkout endpoint and a quarter of all requests failed — one actor driving a failure loop, probably retries against a payment API that started erroring then. Next steps write themselves: check application logs, rate-limit that IP, add backoff to the client.
Practical Use Cases
Debugging Deploy Fallout
The most common incident is self-inflicted: a deploy renames an asset, drops a route, or breaks an API contract. Paste the minutes right after the release — a cluster of 404s on one path, or 500s on a previously clean endpoint, pinpoints what broke, with timestamps matching your release notes.
Bot and Scraper Identification
Scrapers hide from application metrics but not from the rankings. One address sweeping every product page in numerical order, or generating half your traffic at 4 a.m., is unmistakable once aggregated — evidence for an informed rate-limit rule, not a guess.
Capacity Planning
Bandwidth totals and endpoint rankings are budget tools. Before a campaign, paste a comparable historical window and see which endpoints dominate bytes and requests — exactly where a CDN or cache header pays off.
Security Triage
Probing has a shape: many 404s across paths like /wp-admin or /.env, a burst of 401s on login endpoints, a few IPs moving at machine speed. A quick paste confirms whether you are being scanned and hands security a concrete IP list.
Best Practices
- Paste a bounded time window, not a whole week. A focused slice keeps the aggregates meaningful; noise in, noise out.
- Mask client IPs before sharing screenshots. A dashboard image in a public tracker exposes real addresses — replace octets with x characters before sharing outside your team.
- Correlate with application logs by timestamp. Access logs say what happened; application logs say why. Match the spike minute against your error log.
- Compare like-for-like windows. Tuesday against Tuesday, not a launch day, or you will chase ghosts in the ratios.
- Treat 4xx and 5xx differently. Client errors belong to content, links, and bots; server errors belong to your code and infrastructure.
- Keep a pre-incident baseline. Paste a quiet hour during normal operation; any bad window compared against it becomes a measurable delta.
The next time monitoring lights up, do not start guessing. Copy the relevant slice of your access log into the Nginx Log Analyzer and read it like a responder: status codes to triage, IPs and endpoints to name the actor, spikes to place it in time — every byte staying on your machine.
Related Tools You Might Like:
- HAR File Analyzer — the browser side of the same story: request timings, waterfalls, and status codes from DevTools
- URL Parser — break down the long, query-laden endpoints that top your endpoint rankings
- Text Comparator — diff two log windows side by side to see which requests appeared after a deploy
Happy analyzing — may your status codes stay green and your spikes stay explainable!
Frequently Asked Questions
Q: Are my access logs uploaded to a server?
A: No. Parsing and aggregation happen entirely in your browser. The lines — including the IP addresses inside them — never leave your machine, which makes the tool safe for production and privacy-sensitive logs.
Q: Which log formats does the analyzer understand?
A: It parses nginx combined format plus Apache common and combined formats, tolerating mixed input by skipping unrecognized lines. Standard rotation output pastes as-is.
Q: What does a traffic spike actually mean in the report?
A: It marks a time bucket where volume jumped abnormally above the surrounding window. Spikes are candidates, not verdicts — check the status codes and top IPs in the same window to tell a scraper or retry storm apart from a legitimate surge.