Options Profit Calculator: Know Your Max Profit and Loss Before You Trade
The free Options Profit Calculator computes max profit, max loss, break-even price, and a full payoff diagram for long and short calls and puts — entirely in your browser.
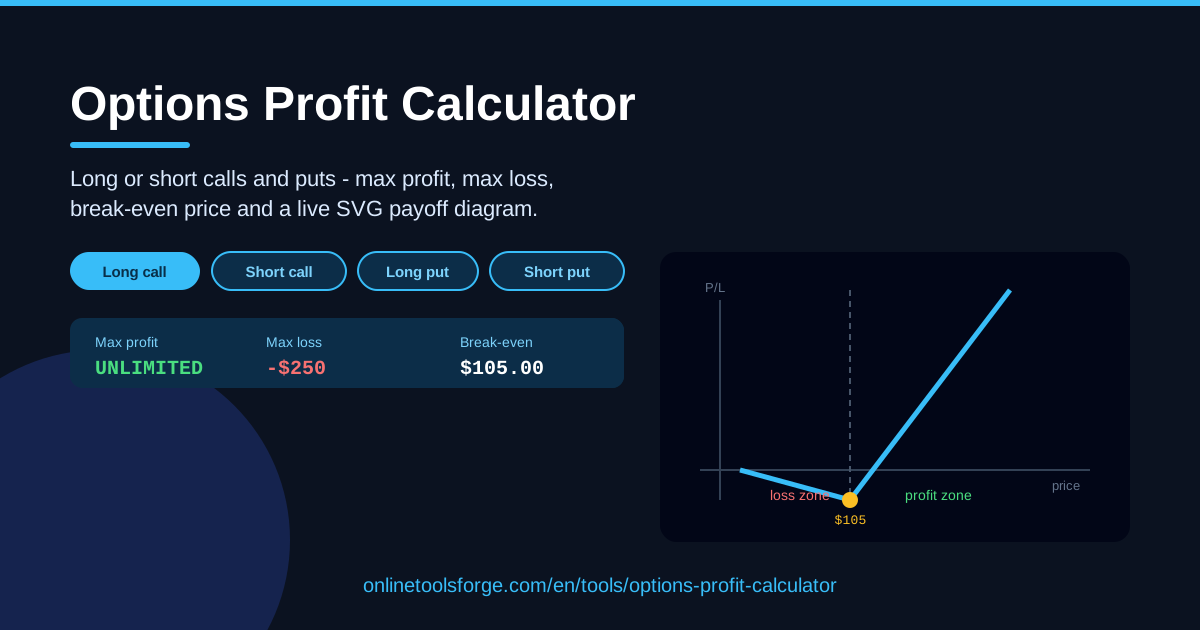
Table of Contents
Options have a reputation for being complicated, but the payoff of a single call or put really comes down to a handful of numbers: the strike price, the premium you pay or collect, and where the stock lands. The trick is seeing how those numbers interact before money is on the line. The Options Profit Calculator makes that easy — pick a long or short call or put, enter your strike price and premium, and the tool immediately shows your maximum profit, maximum loss, break-even price, payoff at the current price, and a payoff diagram that draws the whole story.
Everything runs entirely in your browser: nothing to install, no account to create, and none of your inputs ever leave your device. That makes it just as useful for someone learning what a call option is as for an experienced trader double-checking a short put before selling it.
Why Use Options Profit Calculator?
- Know your worst case before you commit. Every trade has two hard numbers — the most you can make and the most you can lose — and the calculator surfaces both instantly, so a short call's theoretically unlimited loss never takes you by surprise.
- Find the break-even price at a glance. A long call breaks even at strike plus premium, a short put at strike minus premium — read the exact number instead of doing mental arithmetic.
- Compare strategies in seconds. Flip between long and short calls and puts and watch the risk profile flip from capped loss with open-ended gain to capped gain with potentially huge loss.
- See the shape of the trade. The SVG payoff diagram shades profit and loss zones and marks the break-even point, building intuition far faster than a table of numbers.
- No spreadsheets, no sign-up. The tool runs entirely client-side — open the page, enter numbers, get answers.
- Learn the vocabulary painlessly. Strike, premium, and break-even labeled on a live chart make the concepts stick better than textbook definitions.
Key Features
| Feature | What it does |
|---|---|
| Strategy picker | Choose long or short on a call or a put; every output updates instantly |
| Strike and premium inputs | Enter the option's strike price and premium per share |
| Max profit / max loss | Shows the theoretical best and worst outcomes at expiration |
| Break-even price | Calculates the stock price where the trade neither profits nor loses |
| Payoff at current price | Estimates the payoff if the stock stays where it is today |
| SVG payoff diagram | Draws the full payoff curve with shaded profit and loss zones and a break-even marker |
| Fully client-side | All math runs in the browser — no uploads, no accounts |
Two details worth calling out:
- Contract-aware totals. Enter the number of contracts and the standard multiplier, and results scale from per-share figures to real dollar amounts.
- Instant recalculation. Change the premium or strike and every metric and the diagram redraws immediately, making what-if comparisons effortless.
How to Use Options Profit Calculator
- Pick your strategy. Choose long or short, then call or put. A long call profits when the stock rises, a long put when it falls; the shorts are mirror images.
- Enter the strike price and premium. Take both from your broker's option chain: the strike is the price at which the option can be exercised, and the premium is what you pay or collect per share.
- Fill in contract details. Add the number of contracts so totals reflect your actual position size, not a single share's worth.
- Read the headline metrics. Max profit, max loss, break-even price, and payoff at the current price — four numbers that summarize the entire trade.
- Study the payoff diagram. Trace the curve from deep loss to deep profit, note where it crosses zero (your break-even), and check how far the stock must move before the trade pays.
Reading a Payoff Diagram
A payoff diagram plots profit or loss on the vertical axis against the stock price at expiration on the horizontal axis. Once you can read one, you can read them all, because every basic option position is a variation on the same few shapes.
The long call V-shape. Below the strike the line runs flat at exactly the premium paid — you would never exercise, so the loss is capped. At the strike it kinks and climbs dollar-for-dollar with the stock, crossing zero at strike plus premium. The stock must rise by more than the premium before you see a cent of profit; after that, the upside is unlimited.
The capped profit of a short put. If the stock stays above the strike, the option expires worthless and you keep the entire premium — that plateau is your maximum profit, and it can never grow. Below the strike, the line slopes down a dollar for every dollar the stock drops, all the way toward strike minus premium if the stock goes to zero.
Premium shifts everything. The premium, not just the strike, decides where break-even sits: a cheaper premium moves break-even closer but usually means a strike further from the money, and a richer premium does the opposite. The diagram makes this trade-off visible in a way formulas never do.
Unlimited versus capped. Long options have capped losses with large or unlimited gains; short options collect premium up front but carry uncapped (short call) or very large (short put) potential losses. The shape of the line tells you instantly which side of the bargain you are on.
Practical Use Cases
Checking a Covered Call's Capped Upside
You own 100 shares at $50 and sell a $55 call for a $2 premium. Model the short call to see the ceiling: maximum profit is the $200 premium, and losses above $55 grow without limit unless you hold the shares underneath. The flat payoff line makes it obvious that a covered call trades away big upside for income — good to know before the stock rips past your strike.
Sizing Risk Before Buying a Long Call
Before paying $3.50 for a call, enter the numbers and look at the maximum loss: the full premium, times 100, times the number of contracts. Five contracts means $1,750 entirely at risk — and the payoff at the current price shows how far the stock must climb just to break even.
Teaching Options Basics
Explaining calls and puts to a friend, a class, or your future self? Change one input and watch the break-even marker slide. Pairing "long calls profit when stocks rise" with an actual V-shaped line beats a page of definitions.
Comparing Strike Choices
Run the same stock through $50, $55, and $60 calls and compare break-evens, max losses, and diagrams. Cheaper out-of-the-money strikes need bigger moves to profit; in-the-money strikes cost more but break even sooner.
Best Practices
- Remember these are expiration payoffs. The diagram assumes you hold to expiration; before then, time value and implied volatility also move the option's price.
- Include fees in your real numbers. Commissions and bid-ask spreads nibble at every trade, so a slightly padded premium is more honest than the mid-quote.
- Respect assignment risk on shorts. American-style options can be assigned early, especially short calls around dividends — the chart shows expiration outcomes, not early exercises.
- Mind the multiplier. One standard contract controls 100 shares, so confirm the contract details before reading dollar totals.
- Treat this as education, not advice. The calculator shows what a position can do, not whether you should do it — sizing and risk tolerance remain your call.
- Re-run before every trade. Premiums move daily; last week's numbers describe a different trade.
Ready to see what your next options trade could do? Open the free Options Profit Calculator, pick a strategy, and get max profit, max loss, break-even price, and a full payoff diagram in seconds — no sign-up, and nothing ever leaves your browser.
Related Tools You Might Like:
- Compound Interest Calculator — see how reinvested returns compound over time.
- Profit Margin Calculator — check the profitability of the businesses behind the tickers.
- Mortgage Calculator — model the other big leveraged purchase in your life.
Happy trading!
Frequently Asked Questions
Q: Is the Options Profit Calculator free to use? A: Yes. It runs entirely in your browser with no sign-up, no downloads, and no limit on how many scenarios you test.
Q: Does the payoff diagram show the option's value before expiration? A: No. It models payoff at expiration, when an option is worth only its intrinsic value; before then, time value and implied volatility can push the market price above or below the line.
Q: What inputs do I need before starting? A: Just the strike price and premium from your broker's option chain, plus the number of contracts. The tool handles the per-share math and scales it to your position.
Q: Does the calculator warn me about assignment risk? A: Results describe expiration outcomes, so treat short options with care: they can be assigned early, and the real result can differ from the theoretical payoff on the chart.