Payback Period Calculator: Find Out When Your Investment Pays Off
Calculate simple and discounted payback periods instantly. Enter your investment and yearly cash flows to see exactly when a project breaks even — free and 100% in your browser.
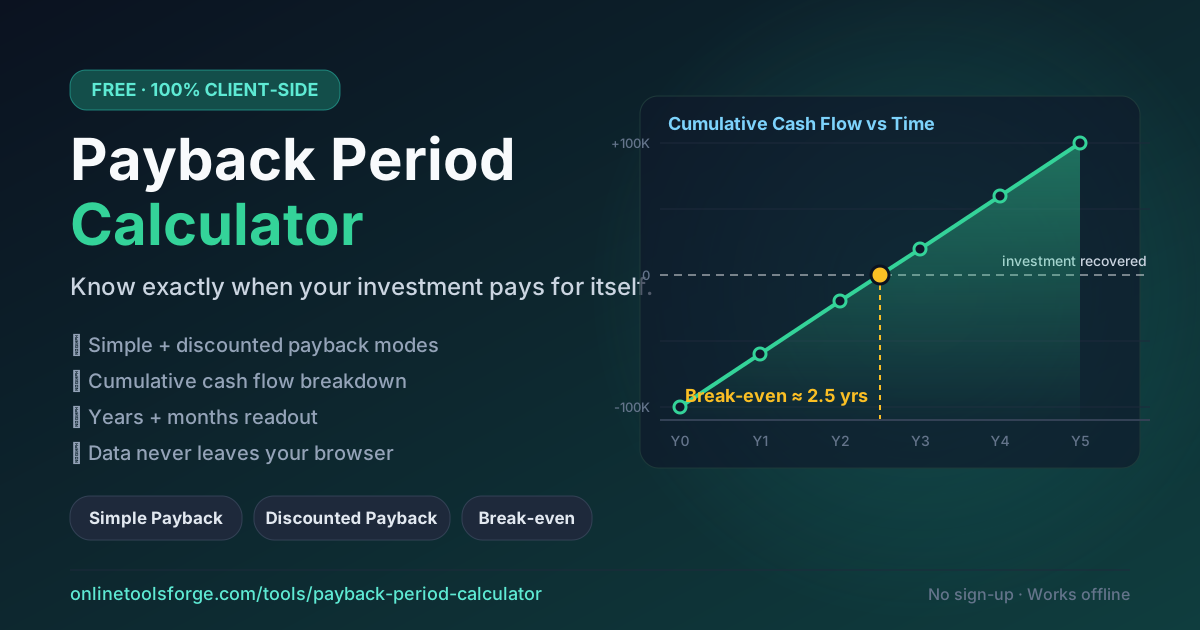
Table of Contents
Payback Period Calculator: Find Out When Your Investment Pays Off
Every investment decision eventually comes down to one blunt question: when do I get my money back? Whether you're a developer pricing out a new SaaS feature, a founder choosing between growth initiatives, or an operations manager justifying an equipment upgrade, the answer is the payback period: the investment recovery time, or how many years of cash inflows it takes to match the money you put in.
You could wrestle the math into a spreadsheet, but the payback period calculator does it faster and with fewer formula errors. Enter an initial investment and a list of yearly cash flows, and you get the simple payback period and the discounted payback period side by side, backed by a cumulative cash flow table and a plain-English readout like "2 years 6 months." Everything runs 100% client-side, so your financials never leave your browser. This guide covers why the metric matters, how the math works, and how to apply it to real capital budgeting and investment appraisal decisions.
Why Use a Payback Period Calculator?
- Instant risk screening. Payback is the fastest investment appraisal lens you have: a short recovery time means less exposure to shifting markets, churn, or obsolescence.
- No spreadsheet gymnastics. No cumulative formulas, no interpolation cells, no broken references — the tool keeps the running totals and handles month-level precision for you.
- Time value of money, built in. Discounted mode converts every future cash flow into today's dollars, so a "3-year payback" can't quietly ignore inflation and opportunity cost.
- A number everyone understands. "We recover our cash in 2 years 6 months" lands with engineers, founders, and CFOs alike — think of it as a break-even time calculator for capital budgeting.
- Fast scenario comparison. Reset and retype a pessimistic forecast in seconds; when a project's payback doubles under mild pessimism, you've learned something cheap.
- Private by design. Every calculation happens in your browser — no sign-up, no uploads, no financial data leaving your machine.
Key Features
| Feature | What it does |
|---|---|
| Two calculation modes | Simple payback or discounted payback — switch anytime |
| Discount rate input | Defaults to 10%; set it to your cost of capital |
| Multiple cash flow rows | Add one row per year, for any horizon |
| Cumulative cash flow table | Running totals of nominal and discounted values per year |
| Years + months readout | "2 years 6 months" alongside a decimal like "2.53 years" |
| Copy summary to clipboard | Share-ready result summary in one click |
| Reset button | Clear the board and model the next scenario |
| Negative-result handling | Reports "not recovered within horizon" when flows fall short |
A few details worth knowing:
- Per-year discounting. Every row is discounted with the standard present-value formula cf / (1 + rate)^period, and the table shows each year's discounted value alongside its running total.
- Mid-year interpolation. When the cumulative total crosses your initial investment partway through a year, the tool interpolates inside that year instead of rounding to whole years.
- USD formatting throughout. Inputs and table figures are formatted in USD, making the running totals easy to scan and compare.
How to Use
- Enter the initial investment. Type the full day-zero outlay: purchase price, development cost, installation — everything that leaves your pocket up front.
- Choose a mode. Pick simple payback for a quick answer, or discounted payback to weigh the time value of money.
- Add yearly cash flows. Add a row for each year in your forecast and enter that year's expected net cash inflow.
- Set the discount rate (discounted mode only). The default 10% suits many corporate cost-of-capital estimates; adjust it to match your funding reality.
- Read the results. The result card shows the payback in years (e.g., "2.53 years") plus the years-and-months readout and the full cumulative table. Copy the summary for your deck, or reset to model the next project.
Understanding Payback Period: Simple vs Discounted
Simple payback — often just called cash flow payback — asks one question: how many years of nominal inflows does it take to recover C0, the initial investment? The tool tracks the cumulative cash flow year by year, and when the running total crosses your investment, it interpolates inside the crossing year:
Payback = (period - 1) + (C0 - prevCum) / cf
Here period is the first year the cumulative total turns positive, prevCum is the cumulative cash flow through the previous year, and cf is the current year's inflow. The fraction is converted to months, so a decimal like 2.53 reads out as "2 years 6 months" (0.53 × 12 ≈ 6).
Discounted payback asks a harder question: when do present-value inflows recover the investment? Each year's cash flow is first shrunk to today's dollars:
Discounted CF (year n) = cf / (1 + rate)^n
The same cumulative-and-interpolate logic then runs on the discounted column. Because future dollars are worth less than present ones, the discounted payback period always equals or exceeds the simple payback — and the gap widens as the discount rate climbs or cash flows sit further out. If the totals never reach your investment within the rows you entered, the tool says so plainly: "not recovered within horizon." That's not an error; it's a verdict worth having before you sign anything.
Practical Use Cases
Evaluating a SaaS Feature Build
A new feature costs $40,000 to build and should generate net inflows of $10,000, $15,000, $20,000, and $20,000 over four years. Simple payback lands at 2.75 years — "2 years 9 months" — because cumulative inflows cross the $40,000 mark partway through year three. Discount the flows at 10% and recovery stretches to about 3.26 years ("3 years 3 months"). The project still looks healthy, but the discounted view sets a more honest expectation for when the cash is truly back.
Comparing Equipment Purchases
Two machines each cost $12,000. Machine A saves a level $4,000 a year; machine B ramps up — $2,000, $4,000, $6,000, $6,000 — as operators climb the learning curve. Both post the same simple payback of exactly 3.0 years, which would normally force a coin flip. Discounted mode at 10% breaks the tie: A recovers in about 3.75 years ("3 years 9 months"), B in roughly 3.58 years ("3 years 7 months"), because B's larger later-year savings outweigh its slow start in present-value terms. When simple payback ties, the discounted payback calculator hands you a defensible tiebreaker.
Sizing Up a Solar Installation
An $18,000 rooftop array that saves $2,400 a year shows a simple payback of 7.5 years — "7 years 6 months." Run the same flows through discounted mode at 10% and the payback balloons to roughly 14.5 years, because a long, flat stream of identical savings suffers badly under discounting. That doesn't kill the project — panels produce for decades — but it states the investment recovery time in today's dollars, which is what a finance-minded stakeholder will ask for.
Best Practices
- Enter cash, not accounting profit. Use the money that actually moves: collections minus cash costs. Depreciation is not a cash flow; capex timing is.
- Match the discount rate to reality. Use your actual cost of capital or borrowing rate, then re-run at several rates to see how sensitive the answer is.
- Don't stop at the break-even year. Payback ignores everything after recovery; a project that pays back in 2 years and stops is worse than one that pays back in 3 and runs for 15. Pair it with the NPV and IRR calculators below for the full picture.
- Compare on a consistent horizon. When ranking projects, model the same number of years for each so "not recovered within horizon" verdicts are apples-to-apples.
- Stress-test the inputs. Shave 10–20% off each year's inflow and recalculate; if the payback doubles, the project is fragile.
Ready to Find Your Break-Even Point?
Decision meetings get shorter when you walk in with a number: "this pays for itself in 2 years 6 months." Open the free payback calculator, spend sixty seconds entering your investment and expected cash flows, and leave knowing exactly when your money comes home — in nominal and present-value terms.
Related Tools You Might Like:
Happy calculating!
Frequently Asked Questions
Q: What is the payback period?
A: It's the time it takes for a project's cumulative cash inflows to equal the initial investment. The calculator reports it as decimal years ("2.53 years") and in plain language ("2 years 6 months").
Q: What's the difference between simple and discounted payback?
A: Simple payback adds up nominal cash flows. Discounted payback first converts each year's flow to present value with cf / (1 + rate)^n, so it always equals or exceeds the simple figure.
Q: What discount rate should I use?
A: Start with your cost of capital — the return the same money could earn elsewhere. The 10% default fits many corporate projects; riskier ventures often warrant higher rates.
Q: What does "not recovered within horizon" mean?
A: The cumulative cash flows in the rows you entered never reach the initial investment. Add more years to the horizon, or treat it as a red flag for the project's economics.
Q: Is my data uploaded anywhere?
A: No. The tool is 100% client-side: every calculation runs in your browser and nothing is sent to a server.