Rent vs Buy Calculator: Compare the True Lifetime Cost Before You Sign Anything
Compare renting and buying a home with full mortgage amortization, appreciation, property tax, maintenance, and investment opportunity cost. Find your break-even year free in your browser.
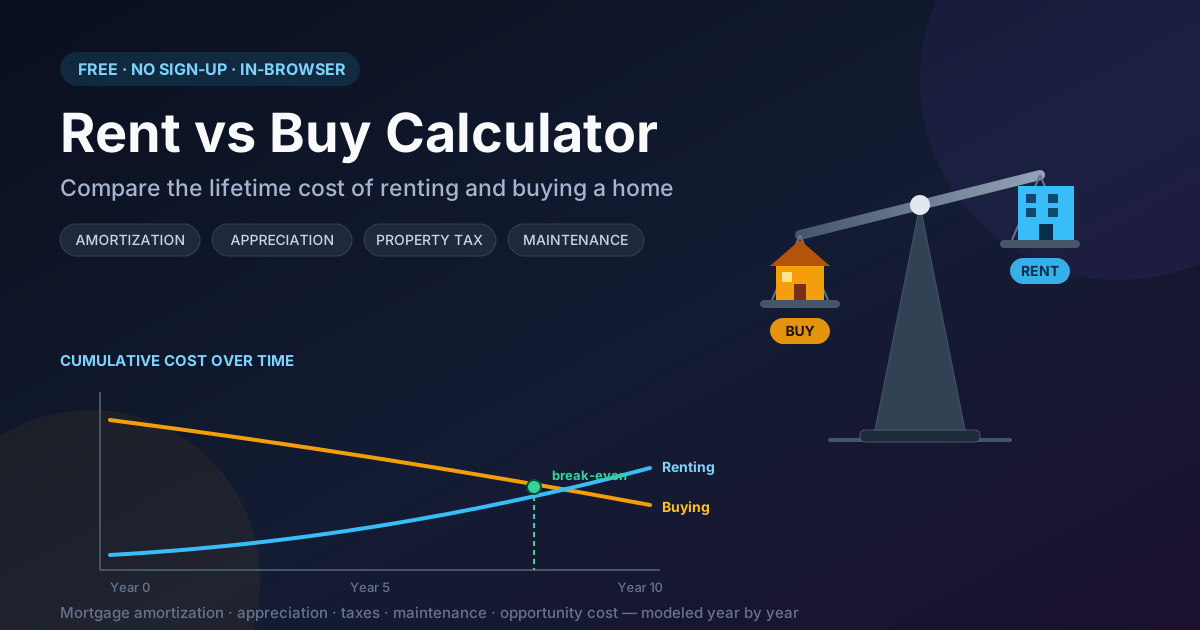
Table of Contents
Rent vs Buy Calculator: Compare the True Lifetime Cost Before You Sign Anything
Rent or buy? Almost every renter eventually faces the question, usually settled with gut feeling or the tired saying that renting is throwing money away. The truth: neither option is universally cheaper. Buying front-loads heavy costs while renting avoids those but builds no equity and exposes you to rent inflation. Which side wins depends on your numbers and how long you stay.
The Rent vs Buy Calculator settles the debate with math instead of folklore. Enter a home price, down payment percentage, mortgage rate, and local rent, and it models the full picture year by year: mortgage amortization, price appreciation, property taxes, maintenance, and — the piece most people forget — the investment opportunity cost of tying up your down payment in a house. It then reports the decisive number: your break-even year, when buying becomes cheaper than renting.
The tool runs 100% client-side in your browser, so you can test dozens of scenarios in minutes without signing up or sending your financial details anywhere.
Why Use Rent vs Buy Calculator?
Here is why running the numbers properly matters:
- See the true lifetime cost, not the monthly payment — A $2,000 mortgage payment does not mean owning costs $2,000 a month. Property tax, maintenance, transaction costs, and opportunity cost are included so you compare like with like.
- Find your break-even year — Buying usually loses in year one and wins by year ten. Knowing where the lines cross tells you whether your planned stay justifies the purchase.
- Include the opportunity cost of your down payment — Money locked in a house cannot be invested. At a 5% return, $80,000 grows by roughly $50,000 over ten years — real growth forgone.
- Model rent inflation honestly — Rent rises almost every year; compounding rent growth judges a cheap lease fairly against a decade of increases.
- Stay private and free — Everything computes locally in your browser. No account, no data collection, no limits.
Key Features
The calculator models the complete financial journey of both paths:
| Feature | What It Does | Default |
|---|---|---|
| Down payment percent | Sets the cash you lock up upfront | 20% |
| Mortgage amortization | Full loan schedule with interest and principal split | 6.5%, 30 years |
| Appreciation rate | Compounds the property value each year | 3% per year |
| Maintenance | Ongoing repair and upkeep reserve | 1% per year |
| Investment return | What your down payment could earn if invested | 5% per year |
| Break-even year | First year buying becomes cheaper than renting | Computed |
- Year-by-year comparison — See how the cost gap evolves annually, revealing how decisively one option beats the other.
- Holding-period control — Evaluate a two-year relocation and a thirty-year forever home with the same tool.
How to Use
You can produce a complete rent-versus-buy analysis in under two minutes:
- Enter the home price. Start with realistic listings in your target neighborhood — say $400,000 — not an aspirational number.
- Set the down payment percentage. The default is 20%; also try 10%, because a smaller down payment changes the loan size and the opportunity cost.
- Enter your mortgage rate, rent, and growth assumptions. Use an actual rate quote, and keep rent growth near 3% unless you have local evidence otherwise.
- Review taxes, maintenance, and investment return. The defaults are sensible, but adjust property tax to your local rate because it varies enormously by region.
- Set your holding period and read the break-even year. If break-even falls well inside your expected stay, buying usually wins; if it falls outside — or never arrives — renting is likely cheaper.
The Hidden Costs on Both Sides
Most rent-versus-buy arguments fail because each side quietly ignores its own ugly costs.
The buying costs people forget. The sticker costs are only the beginning. Property tax arrives every year regardless of income — at 1.1% of a $400,000 home, that is $4,400 annually, forever. Maintenance is the most underestimated line: the standard rule of about 1% of home value per year means roughly $4,000 annually. The sneakiest cost is opportunity cost: your down payment stops working for you — $80,000 invested at 5% becomes about $130,000 in ten years, roughly $50,000 of growth forgone. Finally, transaction costs bite at both ends: about 2% in closing costs when you buy and 6% when you sell.
The renting costs people forget. Rent inflation compounds relentlessly: $1,800 a month growing at 3% becomes roughly $2,350 by year ten, and you will still be paying rent in year twenty, long after a fixed mortgage payment has stayed put. And you build no equity: every rent check converts your income into someone else's asset.
Why the break-even year matters. Because buying pays heavy fixed costs upfront while renting pays rising costs forever, the cumulative cost lines always cross somewhere. Before that year renting is cheaper; after it, buying usually wins as amortization shifts payments toward principal. That crossing point — not opinions — is the real answer.
A worked example with round numbers. Take a $400,000 home with 20% down ($80,000) on a 30-year loan at 6.5%. Principal and interest run about $2,025 per month; add property tax (about $367) and maintenance (about $333) and true ownership cost is roughly $2,725 a month, against $1,800 rent — worse for the first years. Fast-forward ten years: the home has appreciated 3% annually to about $535,000, amortization has retired roughly $49,000 of the loan, and equity approaches a quarter of a million dollars, while rent has climbed past $2,300 with nothing saved. Somewhere in that window — typically years five to eight under these assumptions — the lines cross.
Practical Use Cases
Job relocation decisions
Received an offer in another city and wondering whether to buy there or rent first? Model a short holding period of three to five years. When break-even falls beyond your likely stay, renting is usually the rational choice.
Comparing cities
A high-priced metro with low taxes and strong appreciation can beat a cheap metro with punishing property taxes and flat prices. Run the same inputs against each city's prices, tax rates, and rents to see which market favors buyers.
Timing a first purchase
Test different down payment percentages and price points to learn how much longer renting lets the math work in your favor — and what home price would make buying today already worthwhile.
Refinance versus stay
Already own? Model your remaining balance as a shorter new loan and compare lifetime cost against renting a comparable unit. If renting wins even on generous assumptions, your equity may work harder elsewhere.
Best Practices
- Use realistic appreciation, not hope. Long-run home appreciation hovers near 3%; assuming 8% because the last two years were hot is how people justify bad purchases.
- Stress-test higher rates and lower returns. Run the scenario one to two points above your quoted rate and investment returns at 3% and 7%. If buying wins across the range, the decision is robust.
- Include transaction costs in your head even if you plan to stay forever. Life changes, and the 2% in and 6% out friction is why short holds rarely favor buyers.
- Revisit annually. Rates, rents, and prices move; rerun the numbers each time your lease renews or rates shift materially.
- Be honest about your holding period. The most decisive input is how long you will actually stay, and people underestimate how soon they move.
Ready to Run Your Own Numbers?
Opinions are free; your break-even year is one calculation away. Open the Rent vs Buy Calculator, plug in your local numbers, and find out how long you would need to stay for buying to pay off.
Related Tools You Might Like:
- Mortgage Calculator — break down the payment and amortization behind any loan.
- Compound Interest Calculator — see what your down payment could earn if invested.
- Inflation Calculator — compare rent growth and appreciation against rising prices.
Run the numbers, trust the break-even year, and let the math — not the mythology — make your next housing decision.
Frequently Asked Questions
Q: Does the Rent vs Buy Calculator send my financial data anywhere?
A: No. It runs entirely client-side in your browser. Your inputs never leave your device, and you can run unlimited scenarios without an account.
Q: What is a break-even year, in simple terms?
A: It is the point where the total cost of buying — down payment, mortgage, taxes, maintenance, and forgone investment growth — drops below the total cost of renting the same home. Before that year renting is cheaper; after it, buying usually wins.
Q: What appreciation rate should I use?
A: A long-run average near 3% is a defensible default. If you have strong local evidence for more, test both — the difference between 3% and 5% appreciation changes the break-even year dramatically.