SLA Uptime Calculator: Turn Nines Into Real Downtime Budgets
Convert SLA uptime percentages like 99.9% and four nines into allowed downtime per day, week, month, and year — or measure achieved availability from real downtime, with a 99% to 99.999% tier reference table.
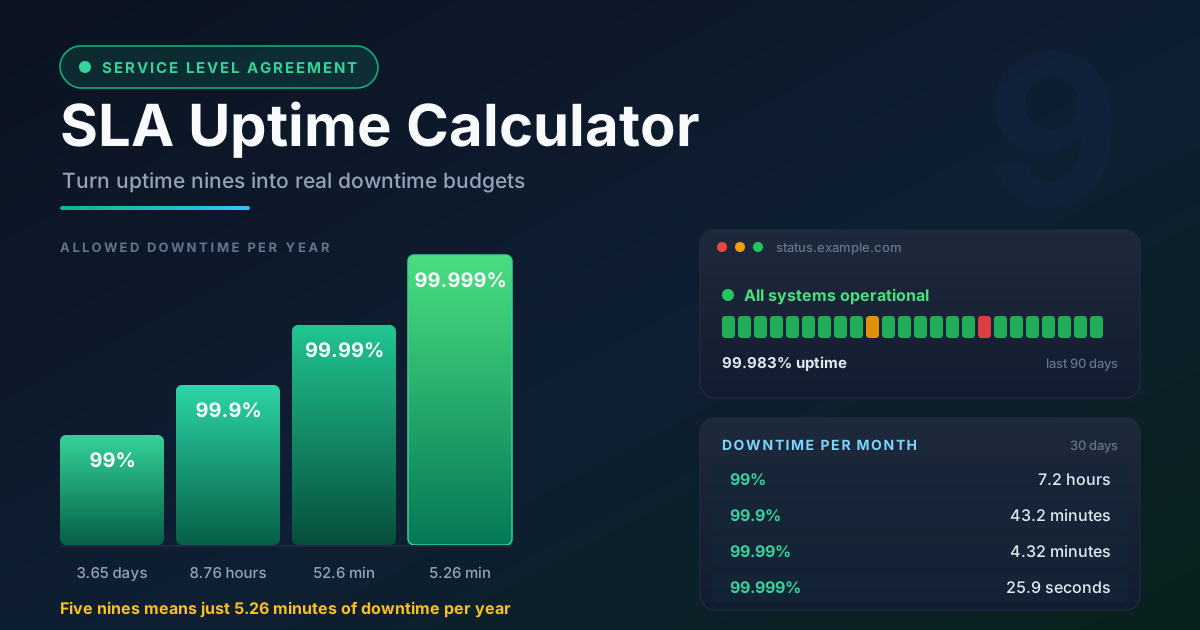
Table of Contents
SLA Uptime Calculator: Turn Nines Into Real Downtime Budgets
Signing a contract that promises "five nines" uptime sounds impressive until you translate it: five nines means at most 5.26 minutes of downtime per year. That is less time than most teams need to acknowledge a pager alert. Promising a number you cannot keep is expensive, and accepting one without knowing its cost is equally risky — know the number before you sign.
The free SLA Uptime Calculator turns any uptime percentage into human-scale numbers: enter 99.9% and it shows the allowed downtime per day, week, month, and year at once. Reverse mode works the other direction — enter the real downtime from an incident and it reports the availability you actually achieved. A tier table covers the 99% to 99.999% ladder, and every calculation runs 100% in your browser.
Why Use SLA Uptime Calculator?
Here is what the tool brings:
- Translate marketing into minutes — "99.9% uptime" is abstract; 43.2 minutes per month is something you can monitor and enforce.
- Price reliability before you buy it — Each extra nine shrinks the downtime budget tenfold, and vendors charge accordingly.
- Verify SLA compliance after incidents — Reverse mode converts real downtime into achieved availability, so you can check whether a credit clause was triggered.
- See the whole ladder at a glance — The 99% to 99.999% reference table makes tier comparisons a seconds-long job.
- Keep the numbers private — The calculator is 100% client-side: your figures never leave your device.
Key Features
The SLA Uptime Calculator is built around two directions of conversion and one reference table.
| Feature | What It Does | Example |
|---|---|---|
| Percent-to-downtime mode | Converts an uptime percentage into allowed downtime | 99.9% input |
| Per-period breakdown | Shows day, week, month, and year at once | 43.2 min per month |
| Downtime-to-percent mode | Measures achieved availability from real downtime | 30 min down |
| Tier reference table | Lists the 99% to 99.999% ladder with downtime | Four nines row |
| Client-side math | Runs entirely in your browser | Instant results |
- Two-way conversion — Plan forward from a target, or audit backward from an outage.
- Deterministic periods — Uses a 30-day month and 365-day year, matching how most providers compute SLA credits.
How to Use the SLA Uptime Calculator
- Choose the percent mode — The default view, for when you start from a promised figure such as 99.9% or four nines.
- Enter the uptime percentage — Type the SLA target from your contract, for example 99.95.
- Read the downtime breakdown — Allowed downtime per day, week, month, and year appears instantly.
- Switch to measured mode for the reverse direction — Enter the actual downtime in minutes and pick the period it occurred in; the calculator returns the availability you achieved.
- Compare against the tier table — Locate your result on the 99% to 99.999% reference, then copy it into a negotiation note or incident review.
What the Nines Cost
Every additional nine divides your downtime budget by ten, which is why the final nine is always the expensive one. Here is the full ladder, using the 30-day month and 365-day year the calculator applies:
| Uptime | Downtime per day | Per week | Per month | Per year |
|---|---|---|---|---|
| 99% | 14.4 minutes | 1.68 hours | 7.2 hours | 3.65 days |
| 99.9% | 1.44 minutes | 10.1 minutes | 43.2 minutes | 8.76 hours |
| 99.99% | 8.6 seconds | 1 minute | 4.32 minutes | 52.6 minutes |
| 99.999% | 0.86 seconds | 6 seconds | 25.9 seconds | 5.26 minutes |
Five nines gives you 5.26 minutes per year — one slow database failover can consume the entire annual budget.
How SLA credits are computed
Most vendor SLAs are measured monthly, with credits set as a share of the monthly fee, tiered by how far you fell below the target. A typical contract promises 99.9%, grants a 10% credit for availability between 99.0% and 99.9%, and 25% below that. But credits are usually capped — often at one month's fee — so a catastrophic month refunds only a fraction of the damage.
Measuring achieved availability from real incidents
Availability is available minutes divided by total minutes; in practice you measure downtime and derive the rest. If your API was unreachable for 26 minutes in a 30-day month, reverse mode shows you achieved 99.94% — comfortably above a 99.9% target. Down 52 minutes instead? That is 99.88%, and you missed. Tracked monthly, this becomes a trendline you can defend at renewal time.
Exclusions and maintenance windows
Read the definitions before celebrating any percentage. Contracts often exclude scheduled maintenance, plus force majeure, your own misconfigurations, and third-party failures outside the vendor's control. A 99.99% promise with a four-hour monthly maintenance exclusion is materially weaker than a 99.9% promise with no exclusions — normalize terms before comparing offers.
Error budgets: the SRE framing
Site Reliability Engineering reframes the same arithmetic as a budget: with a 99.9% monthly SLO, the error budget is the remaining 0.1% — 43.2 minutes of allowable badness. A failed release costs 10 minutes and feature work continues; burn it all, and reliability work takes priority until the budget recovers. The calculator gives you the budget figure directly.
Practical Use Cases
Vendor SLA negotiations
Convert each bidder's promise into minutes per month and compare credit schedules. A vendor selling 99.99% at a 40% premium is offering 39 minutes of avoided downtime per month — judge that against your revenue per minute.
Status page definitions
The number you publish should match your contracts. A 99.9% public commitment implies 43.2 minutes of monthly headroom — never promise more on the status page than the SLA owes customers.
Internal SLO setting
Teams over-promise internally because percentage targets feel free. Pick the maximum tolerable downtime per month, convert it into a percentage, and adopt that as your SLO — a team that can hold 99.5% should not carry a 99.95% target.
Incident review math
After an outage, run measured mode with the real downtime figure. Knowing an incident cost 0.06% of availability — or breached a contractual threshold — sharpens the postmortem and validates any credit claim.
Best Practices
- Define the measurement window in the contract — Monthly windows concentrate risk and make credits attainable; annual windows can hide three bad months behind nine good ones.
- Track monthly, not annually, for credits — Compute achieved availability every month and claim promptly; claim windows are often short.
- Plan the error budget before promising the tier — An SLO without a budget policy is a wish; agree what happens when the budget is spent.
- Define downtime in writing — Fix the failure signal, the detection threshold, and every exclusion before the first incident.
- Measure from your own probes — Vendor dashboards show the vendor's view; your synthetic checks capture what users experience.
- Re-run the numbers at every renewal — Traffic grows and architectures change; last year's tier may no longer fit your risk or your wallet.
Know the Number Before You Sign
Five nines, four nines, three nines — they are all just arithmetic until you put minutes on them. The free SLA Uptime Calculator converts promises into per-period downtime in one view and audits real incidents in reverse — 100% in your browser, nothing uploaded. Check your current contracts today; the answer may change your next negotiation.
Related Tools You Might Like:
- Business Days Calculator — Count working days when planning maintenance windows or credit-claim deadlines.
- Date Range Splitter — Split a quarter into clean monthly windows that match SLA measurement periods.
- Exponential Backoff Calculator — Set retry intervals that protect a struggling service during incidents.
Happy calculating — and may your error budgets stay unspent.
Frequently Asked Questions
Q: How much downtime is 99.9% uptime?
A: Using the standard 30-day month, 99.9% allows 43.2 minutes of downtime per month and 8.76 hours per year; four nines tightens that to 4.32 minutes per month, and five nines to 5.26 minutes per year.
Q: Does five nines include planned maintenance?
A: Many SLAs exclude scheduled maintenance from the availability calculation, effectively extending your allowed downtime. A high percentage with broad exclusions can be weaker than a lower one with none.
Q: How do I calculate the availability I actually achieved?
A: Divide available minutes by total minutes in the period, or enter your real downtime in the calculator's measured mode. For example, 30 minutes of downtime in a 30-day month equals 99.93% achieved availability.
Q: Is my data uploaded anywhere?
A: No. The SLA Uptime Calculator runs 100% client-side in your browser. Your contract percentages and incident figures never leave your device.