CSV Pivot Table: Summarize Any CSV With Group-By Aggregations
Summarize CSV data online with group-by rows and sum, average, count, min, or max aggregations — like a spreadsheet pivot table, free and fully in your browser.
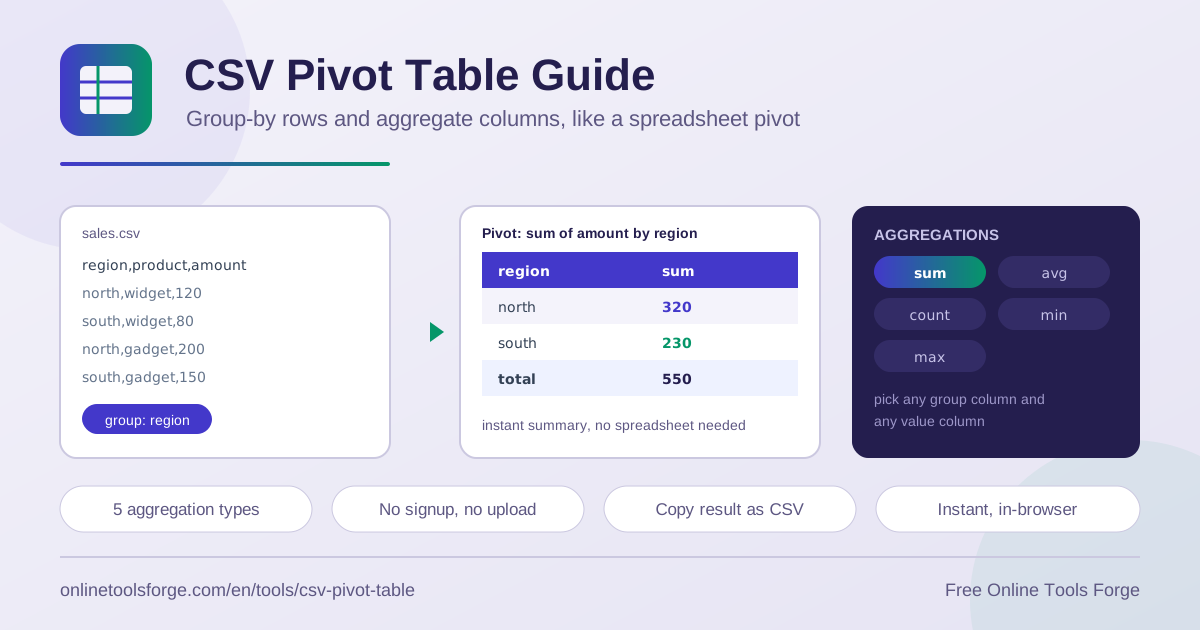
Table of Contents
Raw CSV exports are great at storing data and terrible at answering questions. A file with ten thousand transaction rows tells you almost nothing at a glance — what you really want is total revenue per region or the average order per product line. That is the job of a pivot table, and until now it usually meant opening Excel or writing a script.
The free CSV Pivot Table tool gives you spreadsheet-style pivoting directly in your browser. Paste or upload a CSV, pick one column to group by, pick a value column, choose an aggregation — sum, average, count, min, or max — and thousands of rows collapse instantly into a compact grouped summary.
Everything runs locally. No account, no upload, no waiting: your data never leaves your machine, and the result is ready to copy as CSV the moment it appears.
Why Use the CSV Pivot Table Tool?
- No spreadsheet required: No Excel, Google Sheets, or plugins needed. Open the tool in any browser tab and start grouping immediately.
- Instant summaries: A pivot turns huge files readable in seconds — ten thousand rows become eight grouped lines, recalculated the moment you change a setting.
- Fully private: The file is never uploaded to a server. Sensitive exports — sales figures, customer lists, internal logs — stay on your own device.
- Deliberately simple: Instead of a four-pane drag-and-drop builder, you choose two things: a group-by column and a value column. That covers most everyday summarization with no learning curve.
- Five practical aggregations: Sum, average, count, min, and max cover most reporting questions, from revenue rollups to survey tallies.
- Copy-ready output: The grouped result copies straight back out as CSV, ready for an email, report, slide, or another tool.
Key Features
| Feature | What it does |
|---|---|
| Paste or upload | Accepts CSV pasted from the clipboard or loaded from a local file. |
| Group-by column | Sets the column whose distinct values become the summary rows. |
| Value column | Sets the numeric column to aggregate within each group. |
| Aggregation choice | Sum, average, count, min, or max applied per group. |
| Missing value handling | Skips rows without a usable value so blanks never distort results. |
| Copy result | Exports the grouped summary as clean CSV in one click. |
- The tool builds summaries like sum of amount by region automatically, so results update instantly when you switch columns or aggregation.
- Rows without values are handled gracefully: empty or non-numeric entries are excluded from sum, average, min, and max rather than treated as zero, keeping averages honest.
- Output is plain CSV, so it round-trips cleanly into spreadsheets, wikis, and other text tools.
How to Build a Pivot From CSV
- Paste or upload your CSV. Drop rows into the input area or load a .csv file; the first row is treated as the header.
- Pick the group-by column. Choose the column to summarize along — region, category, product, or event type. Each distinct value becomes one result row.
- Pick the value column. Select the numeric column to aggregate, such as amount, price, quantity, or score.
- Choose the aggregation. Sum for totals, average for typical values, count to tally rows, min and max for the smallest and largest values per group.
- Review and copy. The grouped table appears instantly; copy it as CSV and paste it wherever you need it.
If the summary looks wrong, switching a column recalculates in real time — nothing to rebuild or re-run.
How Group-By Aggregation Works
A pivot is two operations chained together. First, grouping: every row is assigned to a bucket based on its value in the group-by column — all East region sales share one bucket. Second, aggregation: the values in the value column are combined within each bucket into a single number.
Each aggregation answers a different question. Sum answers how much in total, like revenue per region. Average answers what is typical, like mean order value per channel. Count answers how many — responses per option or events per log level — and needs no numeric column at all. Min and max find the smallest and largest values, like the cheapest price per category or slowest response per endpoint.
Choosing the right columns is the main skill. The group-by column should be a category with a modest number of distinct values — region, status, category, day. Grouping by something with thousands of unique values, like an ID or timestamp, produces one row per input row and summarizes nothing. The value column should hold the number you want to roll up; for pure tallies, count lets you skip it.
Missing values are handled deliberately. Rows where the value column is empty or non-numeric are skipped for sum, average, min, and max, so a blank never drags an average toward zero. With count, every row still tallies, because the point is counting rows, not values.
Here is a small worked example — three sales rows grouped by region and summed by amount:
region,amount
East,120
West,80
East,200
Pivoting this with group by region and sum of amount produces two lines: East with 320 and West with 80. Two East rows collapsed into one grouped row — the same job a formula or script would do, done in milliseconds.
Practical Use Cases
Sales Rollups by Region
Export transactions as CSV, group by region or sales rep, and sum the amount column for an instant revenue rollup. Switch to average to compare typical deal sizes, or max to spot the biggest single sale per territory.
Survey Response Tallies
Survey exports usually have one row per respondent. Group by a question column and use count to see how many respondents chose each option — a clean tally without formulas. Use min and max on a rating column to see the range of opinions per question.
Expense Summaries by Category
Group an expense export by category and sum the amount to see where the money went this month. Counting rows per category shows transaction frequency, and max reveals the single largest expense instantly.
Log Event Counts
Logs exported as CSV typically include a level, type, or endpoint column. Group by that column and count rows for an event distribution — errors versus warnings, requests per endpoint. Pair it with min and max on a duration column to find the fastest and slowest operations per group.
Best Practices
- Group by low-cardinality columns. Categories with a handful of distinct values produce readable summaries; unique IDs produce noise.
- Verify your header row. It defines the column names, so a garbled header makes the wrong column easy to pick.
- Prefer sum for money, average for behavior. Totals answer how much revenue or cost; averages answer how typical users or orders behaved.
- Watch for inconsistent labels. East and east group separately, so clean variants before pivoting.
- Use count when no numeric column fits. Row tallies are often the most honest summary for surveys and logs.
- Copy results as you go. Snapshot each useful view before experimenting with different groupings.
Summarize Your Data in Seconds
You do not need a spreadsheet license or a data script to answer simple questions about your files. Open the free CSV Pivot Table tool, paste your data, pick two columns, and choose an aggregation. Thousands of rows become a clear grouped summary — entirely in your browser, with nothing uploaded and nothing to sign up for.
Related Tools You Might Like:
- CSV Cleaner — tidy messy CSV files before you pivot: trim spaces, fix delimiters, remove empty rows.
- CSV Merger — combine multiple CSV files into one dataset, then summarize it with a pivot.
- CSV Transposer — flip rows and columns when your categories run across instead of down.
Happy summarizing!
Frequently Asked Questions
Q: Is my CSV data uploaded anywhere when I use the tool?
A: No. The tool runs entirely in your browser, so parsing and aggregation happen locally on your device. Nothing is uploaded to a server, and no signup is required.
Q: What is the difference between count and the other aggregations?
A: Sum, average, min, and max operate on numeric values in your chosen value column. Count simply tallies how many rows fall into each group, so it works even with no numeric column at all.
Q: How does the tool handle blank or non-numeric values?
A: Rows without a usable value are skipped for sum, average, min, and max, so they do not distort results. For count, every row in the group is still tallied.
Q: Can I pivot on more than one group-by column?
A: The tool is designed for single-column grouping, which covers most quick summaries. For multi-level grouping, combine your columns into one in the source data first.
Q: How do I get the pivot result back into Excel or Google Sheets?
A: Copy the result as CSV from the tool, then paste it into your spreadsheet or save it as a .csv file. The grouped summary imports like any ordinary CSV.