SQL Join Visualizer: Master Every SQL Join with Venn Diagrams and Sample Tables
SQL Join Visualizer explains INNER, LEFT, RIGHT, FULL, CROSS, and self joins with Venn diagrams and sample tables that show exactly which rows survive each join — entirely client-side.
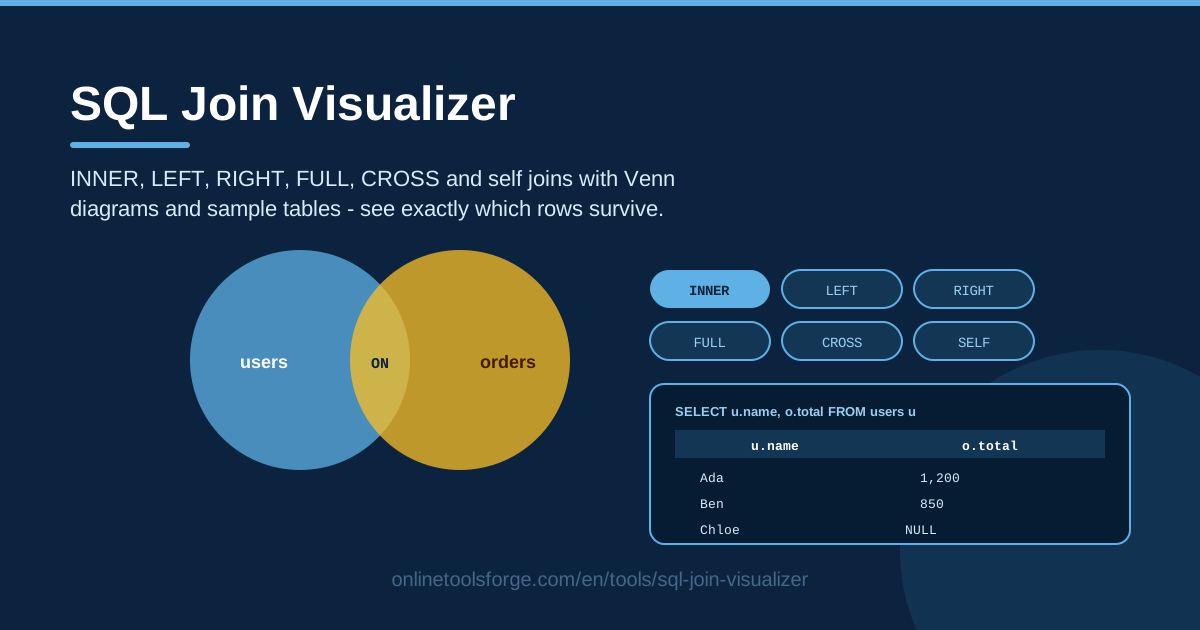
Table of Contents
Joins are usually the first real wall in SQL: you can memorize the definitions in an afternoon and still feel unsure about what a query will actually return. The free SQL Join Visualizer removes that uncertainty. Pick a join type and the tool draws the matching Venn diagram, shows two small sample tables, and reveals the exact result — every row that survives the join and every unmatched row that gets padded with NULLs.
All six joins are covered — INNER, LEFT, RIGHT, FULL, CROSS, and the self join — and everything runs entirely client-side in your browser. There is nothing to install and no data leaves your machine, so you can experiment as freely as you like.
This guide walks through why the tool works, how each join behaves on the sample data, and how to carry the same mental model back to your own database — whether you are learning, teaching, or debugging a report.
Why Use SQL Join Visualizer?
- See the result, not just the theory. The two sample tables sit directly above the joined output, so you can trace any result row back to the exact input rows that produced it.
- One-click comparison. Switch between INNER, LEFT, RIGHT, FULL, CROSS, and self on the same data; the Venn diagram, tables, and result update instantly, making the differences impossible to miss.
- Visible NULL-padding. Unmatched rows confuse everyone at first. The tool shows exactly where NULLs are injected to keep one-sided rows alive, so LEFT and FULL joins stop feeling arbitrary.
- Fully client-side and private. Everything runs in your browser with no sign-up and no server calls, so you can learn without touching a production database.
- Built for teaching. Diagram, inputs, and output share one screen — ideal for walking a junior developer through joins or rehearsing the classic INNER-versus-LEFT interview question.
- Zero setup. Open the page, choose a join type, and explore. It is free, fast, and works in any modern browser.
Key Features
| Feature | What it does |
|---|---|
| Join type picker | Switch between INNER, LEFT, RIGHT, FULL, CROSS, and self joins instantly |
| Venn diagram | Highlights which regions of each table survive the selected join |
| Live sample tables | Small users and orders tables that update to show exactly which rows survive each join |
| NULL-padding explainer | Demonstrates how unmatched rows are kept and filled with NULLs |
| 100% client-side | All logic runs in your browser; nothing is uploaded or stored |
A few details worth calling out:
- Deliberate edge cases. The sample data includes a user with no orders and an order with no matching user — exactly the rows that behave differently across join types.
- Diagram and data stay in sync. Switching join types moves the shaded region and the surviving rows together, wiring the picture to the data in your head.
- A dedicated self join view. See how one table joins to itself through aliases, the standard pattern for hierarchies such as employees and managers.
How to Use SQL Join Visualizer
- Pick a join type. Choose INNER, LEFT, RIGHT, FULL, CROSS, or self. The Venn diagram redraws immediately to match your selection.
- Study the diagram. Note what is shaded: only the overlap for INNER, one whole circle for LEFT or RIGHT, both circles for FULL, and no overlap logic at all for CROSS.
- Walk the sample tables. Read the source tables, then the result underneath. Trace one matched pair and one unmatched row from input to output.
- Notice the NULLs. In LEFT, RIGHT, and FULL modes, find one-sided rows and see how the missing side is filled with NULLs — the reason reports sometimes show half-empty rows.
- Apply it to your query. Once you can predict the output before scrolling to it, take the reasoning back to your real data: decide which rows must survive, then pick the join that keeps them.
Six Joins, One Mental Model
INNER JOIN is the intersection. Only rows with a match on both sides survive — the overlapping lens of the Venn diagram. A user with no orders disappears, and so does an order pointing at a missing user. That is why INNER both feels like the natural default and silently drops data whenever a relationship turns out to be optional.
LEFT and RIGHT JOIN preserve one side. A LEFT join keeps every left-table row and attaches matches from the right, NULL-padding the gaps; RIGHT is the mirror image. In practice LEFT dominates real queries, because people write from the table they care about and reach outward.
FULL OUTER JOIN preserves both sides. You keep matched rows plus unmatched rows from either table, padding whichever side is missing. It is the reconciliation join: compare two datasets and surface everything, matched or not.
CROSS JOIN is the cartesian product. With no join condition, every left row pairs with every right row: five users and four orders become twenty rows. That is perfect for generating combinations and catastrophic when it happens by accident through a forgotten ON clause.
Self joins use one table twice. By giving each copy an alias — manager and employee from the same staff table, say — you join a table to itself. It behaves like any other join; the trick is remembering the aliases are two roles, not two tables.
Where Venn diagrams oversimplify. If one user has three matching orders, a join does not return one row — it returns three, one per match. Duplicate matches multiply, which is why result sets are often bigger than newcomers expect. The sample tables include this fan-out deliberately so you can watch a single left row split into several output rows.
Practical Use Cases
Teaching Joins to Junior Developers
Abstract explanations rarely land. Instead, open the visualizer on a call, pick LEFT join, and ask the trainee to predict the row count before revealing the result. Then switch to INNER and repeat. Ten minutes of predict-and-reveal builds intuition faster than an hour of definitions, and the NULL-padding view answers the "why is this column empty?" question before anyone asks it.
Debugging a Report That Is Missing Rows
When a sales report shows fewer customers than expected, the usual culprit is an INNER join against a table where some customers have no rows yet. Rebuild the shape of the problem in the tool — a left table where every row matters, a right table with gaps — then compare INNER and LEFT on identical data. The row that vanishes under INNER but survives NULL-padded under LEFT is your missing report row.
Choosing LEFT vs INNER for Optional Relationships
Not every relationship is mandatory: a user may have no profile, an order may have no discount code. Use the visualizer to make the call concrete. If the right-hand table is optional and the left-hand row still matters, LEFT is correct. If a missing right-hand row makes the record irrelevant, INNER is right. Seeing both outputs side by side turns a guess into a decision.
Preparing for SQL Interviews
"Explain the difference between INNER and LEFT join" is one of the most common data-interview questions. Practicing with the visualizer lets you answer with a concrete example — two tables, one unmatched row, the exact output — instead of a recited definition. The duplicate-match multiplication case is a favorite follow-up, and the tool demonstrates it in one click.
Best Practices
- Write explicit keywords. Use INNER JOIN and LEFT JOIN rather than bare JOIN or comma-style joins, so intent is visible in code review.
- Check for NULL expansion. After any outer join, decide deliberately what happens to NULL-padded rows: filter them, handle them with COALESCE, or accept them knowingly.
- Watch row counts on fan-outs. Joining one-to-many tables multiplies rows. If 10,000 orders become 40,000 result rows, a duplicate key is inflating every SUM and COUNT downstream.
- Filter before joining when you can. Shrinking each table first keeps the join smaller, faster, and easier to reason about.
- Prefer LEFT JOIN plus IS NULL for anti-joins. Finding users with no orders reads clearly this way and behaves consistently across engines.
- Alias by role, not by table. Especially in self joins, names like manager and employee prevent the classic "which copy am I filtering?" bug.
The fastest way to make all of this stick is to stop reading and start clicking. Open the SQL Join Visualizer, cycle through all six join types on the same sample data, and watch which rows survive each time. Five focused minutes there will transfer directly to every join you write afterward.
Related Tools You Might Like:
- CSV SQL Query — run SQL queries directly against CSV files in your browser.
- JSON to SQL Converter — turn JSON data into SQL INSERT statements in seconds.
- CSV to SQL Converter — convert spreadsheet data into ready-to-run SQL scripts.
Happy querying!
Frequently Asked Questions
Q: What is the difference between an INNER JOIN and a LEFT JOIN? A: An INNER JOIN keeps only rows that match in both tables. A LEFT JOIN keeps every row from the left table and fills the right-hand columns with NULL when no match exists. Switching between the two on the visualizer's identical sample data makes the difference visible in seconds.
Q: Are Venn diagrams an accurate model of SQL joins? A: They are a good first approximation for INNER, LEFT, RIGHT, and FULL joins, but they hide one thing: when several rows match, each match produces its own output row. The sample tables include duplicate matches so you can see one input row fan out into several results.
Q: When should I use a CROSS JOIN? A: Use it when you genuinely want every combination — every product in every size, every day paired with every store, or bulk test data. It only becomes a bug when it happens unintentionally, which is why a missing ON clause should always be investigated.
Q: Is my data uploaded anywhere? A: No. The SQL Join Visualizer runs entirely client-side in your browser. The sample tables are built in, nothing is sent to any server, and no account is required.