SQL Schema Visualizer: Turn CREATE TABLE Statements into ER Diagrams
Paste SQL CREATE TABLE statements and see tables, columns, primary keys, and foreign keys drawn as an ER diagram instantly. A free, private guide to the SQL Schema Visualizer.
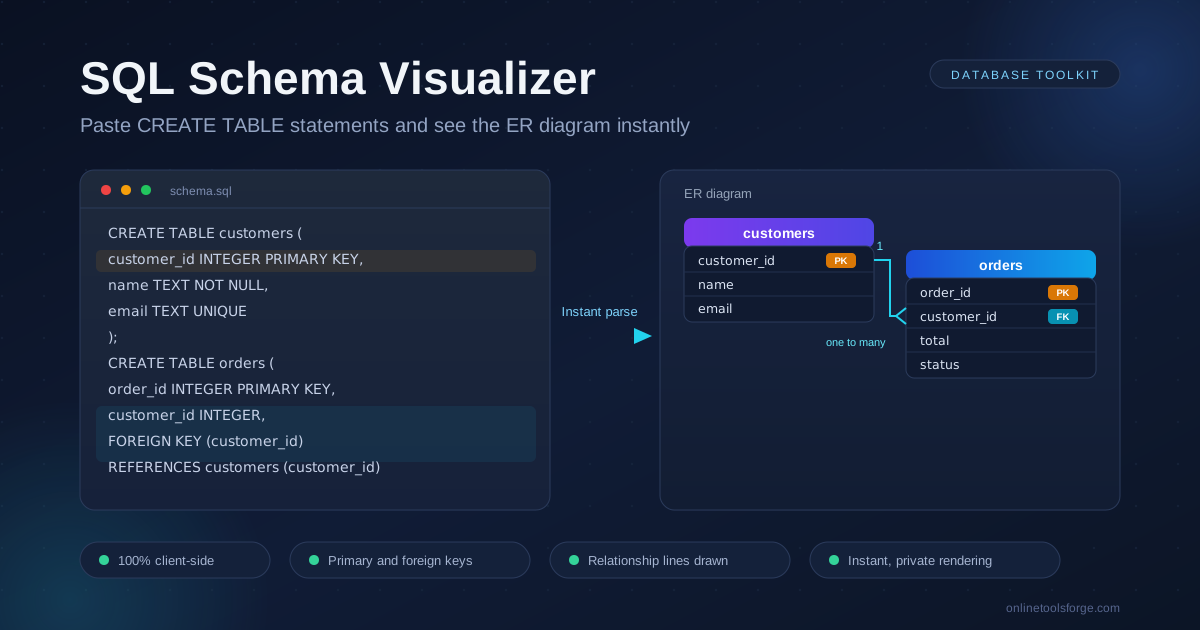
Table of Contents
SQL Schema Visualizer: Turn CREATE TABLE Statements into ER Diagrams
Every database begins life as plain text: a migration file or DDL script full of CREATE TABLE statements defining each table's columns, types, and keys. Reading that text and assembling a mental picture is slow work, and the bigger the schema, the slower it gets. The SQL Schema Visualizer flips the task around — paste your CREATE TABLE statements and see the schema drawn as an entity relationship diagram within seconds.
The speed-up is real because a picture removes the hunting. Instead of scanning for every FOREIGN KEY clause and remembering which column points where, you follow drawn lines between boxes, and join paths become visible at a glance.
The tool is free and runs entirely in your browser: your DDL never leaves your machine, no sign-up is required, and rendering is instant. This guide covers the features, a step-by-step workflow, how the parser reads your DDL, and where a diagram pays off most.
Why Use SQL Schema Visualizer?
- Pictures beat prose: Table boxes plus relationship lines communicate structure faster than raw DDL, especially for schemas you did not write.
- Instant feedback while designing: Change a column, re-paste, and the diagram updates immediately.
- Catches design smells early: Missing foreign keys and disconnected tables stand out long before they become migration headaches.
- Zero setup: Nothing to install, no account to create. Open the page, paste your DDL, and the diagram appears.
- Private by default: Parsing happens client-side, so sensitive schemas stay on your device.
- Free to use: It costs nothing and works offline once the page has loaded.
Key Features
| Feature | What you get |
|---|---|
| CREATE TABLE parsing | Tables and columns appear as boxes the moment you paste |
| Primary key markers | PK columns are highlighted so entity identity is obvious |
| Foreign key detection | FOREIGN KEY clauses become relationship lines between tables |
| Instant rendering | The diagram redraws as soon as the input changes |
| Client-side processing | All parsing runs in the browser; nothing is uploaded |
| No installation | Works in any modern browser on desktop or mobile |
A few details worth calling out:
- Relationship lines are the headline. They turn a list of tables into a map, showing exactly which table references which.
- The layout stays readable even with many tables, so you can paste an entire migration file rather than hand-picked fragments.
- Types travel with columns, so the diagram doubles as a quick data dictionary.
How to Use
- Open the tool: Visit the SQL Schema Visualizer page in your browser.
- Copy your DDL: Grab the CREATE TABLE statements from a migration file, a dump, or your schema documentation.
- Paste into the editor: The diagram renders instantly — each table becomes a box with its columns.
- Check the keys: Confirm primary keys are marked and every FOREIGN KEY clause has produced a line to its referenced table.
- Iterate and share: Adjust the DDL, paste again, and drop the updated diagram into reviews, tickets, or onboarding notes.
From DDL to Diagram
Knowing what the parser reads helps you write DDL that produces accurate diagrams.
What gets parsed. The tool reads CREATE TABLE statements and extracts the table name, every column with its type, columns declared with PRIMARY KEY (inline or as a table constraint), and foreign keys written as FOREIGN KEY (column) REFERENCES other_table (column). From this it builds table boxes plus one relationship line per foreign key.
Why the FK lines matter most. Foreign key lines expose the join paths reviewers look for. When orders.customer_id references customers.customer_id, the line between the two boxes tells you instantly that a join on that pair is valid and which table is the parent. Missing lines are just as informative — a table with no references usually deserves a question.
Reading the diagram. Each box is one entity: header for the table name, body listing columns with primary keys highlighted. Relationship lines use crow's foot notation: a single tick marks the "one" side, a three-pronged foot marks the "many" side. In a customer and orders schema, the foot sits on orders, so one customer can place many orders.
A minimal example makes this concrete:
CREATE TABLE customers (
  customer_id INTEGER PRIMARY KEY,
  name TEXT NOT NULL
);

CREATE TABLE orders (
  order_id INTEGER PRIMARY KEY,
  customer_id INTEGER,
  total NUMERIC,
  FOREIGN KEY (customer_id) REFERENCES customers (customer_id)
);
Pasted in, this draws two boxes joined by a single line — customers on the "one" side, orders on the "many" side — with customer_id marked as the primary key of customers and as a foreign key inside orders.
What is not parsed. The visualizer focuses on structure, not every DDL detail. Indexes, CHECK and UNIQUE constraints beyond what defines keys, triggers, views, and storage options are not drawn. Treat the diagram as a map of tables and relationships; keep the full DDL as the source of truth for everything else. Relationships defined only in application code or an ORM model will not appear unless they exist as FOREIGN KEY clauses in the SQL you paste.
Practical Use Cases
1. Onboarding to an unfamiliar schema
Joining a legacy project? Export its CREATE TABLE statements, paste them, and you have a map of the domain in minutes. New team members orient around core entities instead of reverse-engineering migrations one by one.
2. Design reviews
Paste a proposed schema before the meeting so reviewers see cardinality at a glance and ask sharper questions: Should order_items reference orders? Is this denormalization intentional? A shared picture keeps the discussion concrete.
3. Documentation that stays current
Keep the generated diagram in your team wiki next to the DDL. When the schema changes, re-paste the updated statements and refresh the image, so documentation follows reality instead of drifting.
4. Teaching normalization
Show a denormalized design, discuss normal forms, then paste the corrected DDL to display cleaner entity boundaries. The visual contrast makes an abstract topic tangible.
Best Practices
- Name foreign keys clearly: customer_id referencing customers is self-documenting; ref_id referencing customers is a mystery in code and diagram alike.
- Paste complete DDL: Include every table in the relationships you care about — a diagram of half a schema hides half the join paths.
- Update the diagram after schema changes: Re-paste the current migration output whenever tables change, so the picture never lies.
- Keep one source of truth: Generate DDL from migrations rather than maintaining a hand-edited copy.
- Use consistent naming conventions: Singular or plural, pick one; consistent names make the diagram and the joins easier to read.
- Screenshot for artifacts: Drop the rendered diagram into pull requests and design docs so reviewers see the structure instantly.
See Your Schema in Seconds
Stop reconstructing schemas in your head. Open the SQL Schema Visualizer, paste your CREATE TABLE statements, and watch tables, keys, and relationships become a clear ER diagram — free, instant, and entirely in your browser.
Related Tools You Might Like:
- SQLite Viewer — Open .db files and browse tables and rows without installing anything.
- JSON Formatter — Pretty-print, validate, and minify JSON payloads and config files.
- SQL Formatter — Tidy up SQL queries and DDL scripts before you paste or commit them.
Happy modeling!
Frequently Asked Questions
Q: Is my SQL uploaded to a server?
A: No. Parsing and rendering happen entirely in your browser with client-side JavaScript, so your schema never leaves your machine.
Q: Which SQL dialects work?
A: Standard CREATE TABLE syntax from MySQL, PostgreSQL, SQLite, and SQL Server works. Vendor-specific extras are ignored gracefully.
Q: Does it show indexes and unique constraints?
A: No. The diagram focuses on tables, columns, primary keys, and foreign keys; your DDL remains the source of truth for the rest.
Q: How many tables can it handle?
A: Dozens to over a hundred tables render fine. Very large dumps become dense, so visualize one module at a time.
Q: Can it use relationships defined in my ORM instead of SQL?
A: Not directly. The tool reads DDL, so relationships must exist as FOREIGN KEY clauses in the SQL you paste.