CPU Flamegraph Visualizer: Turn Stack Traces Into an Interactive Flame Graph
CPU Flamegraph Visualizer renders perf script and py-spy output into an interactive SVG flame graph in your browser. Zoom into hot frames, search by name, and find CPU bottlenecks with no install.
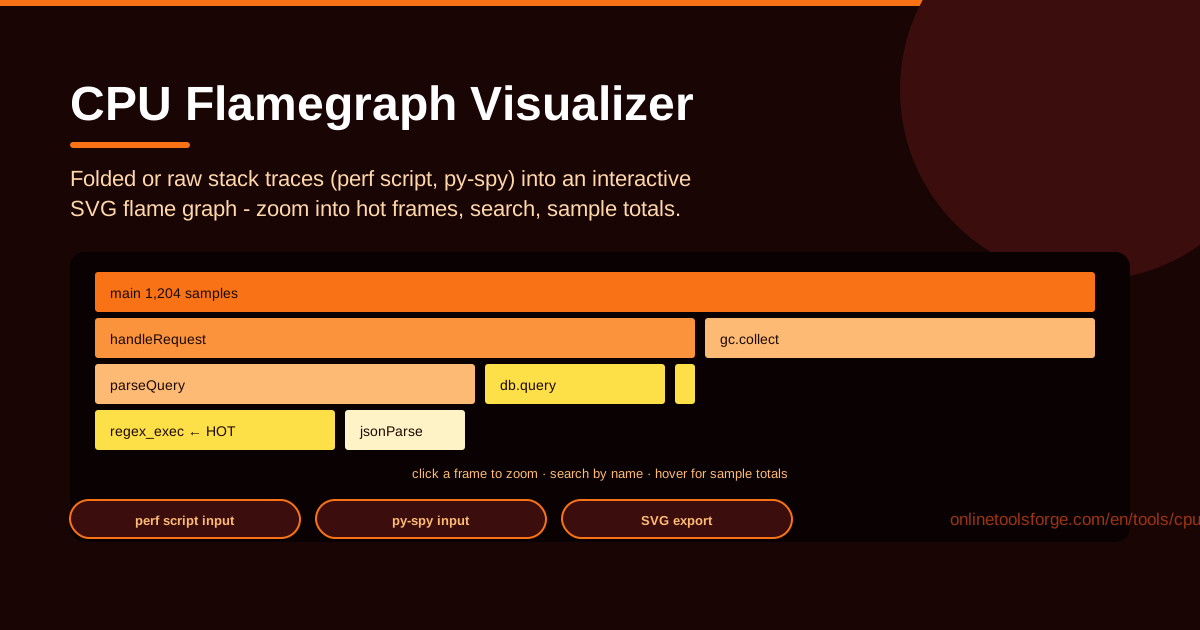
Table of Contents
Every developer eventually hits the same wall: the service is slow, the CPU is pegged, and someone says "just profile it." You run perf or py-spy, collect thousands of lines of stack traces, and realize you have no good way to actually read them. That gap between capturing a profile and understanding it is exactly what the CPU Flamegraph Visualizer was built to close.
The tool accepts folded stack traces or raw profiler output — perf script output from Linux, dumps from py-spy — and renders an interactive SVG flame graph in your browser. Nothing to install, nothing uploaded; within seconds you can zoom into any frame, search for a function by name, and read per-function sample totals that show exactly where the CPU went.
Whether you are chasing a hot regex, diagnosing garbage collection pressure, or just learning what your program does with its time, a flame graph turns thousands of stack samples into one picture you can act on. This guide covers the workflow, how to read the graph, and the habits that make profiling productive.
Why Use CPU Flamegraph Visualizer?
- No-install profiling: Traditional flame graph tooling means cloning repositories, running Perl scripts, and fighting dependencies. Here you paste stacks into a web page and get a graph — it works on a locked-down work laptop just as well as on your own machine.
- Works with tools you already have: If you can produce perf script output on Linux or py-spy output for Python, you already have everything the tool needs. No agents, no SDKs, no code changes.
- Interactive zoom and search: A static image of a large profile is nearly useless. Click a frame to zoom into its subtree, and search by name to highlight every matching frame at once.
- Per-function sample totals: Concrete numbers beat eyeballing widths — you can say "this function accounts for 30% of samples" with confidence in a review or incident call.
- Your data stays local: Profiles can contain internal function names and endpoint paths. Rendering happens client-side, so sensitive stacks never leave your machine.
- Minutes, not hours: The trip from "the server is slow" to "there is the hot frame" shrinks from a tooling afternoon to a couple of minutes.
Key Features
| Feature | What it does |
|---|---|
| Folded stack input | Paste stacks in the classic frame;frame;frame count format and render them instantly. |
| Raw profiler support | Paste raw perf script or py-spy output; the tool folds the stacks for you. |
| Interactive SVG rendering | Every frame is a clickable, hoverable rectangle showing its name and share of samples. |
| Zoom into frames | Click any frame to expand its subtree to full width; reset to zoom back out. |
| Search by name | Highlight every frame matching a function so you can see all of its call paths. |
| Per-function totals | Get aggregate sample counts per function, summarizing the whole profile in one list. |
A few details worth knowing:
- Folding — turning thousands of raw samples into aggregated lines — is the step most people trip over with command-line tooling, and the tool handles it for both perf script and py-spy formats.
- The SVG output screenshots cleanly, so your flame graph stays sharp in incident reports, pull requests, and slides.
- Profiles containing thousands of unique stacks still render fine, so a 30-second production capture will not slow the page down.
How to Use CPU Flamegraph Visualizer
- Capture a profile. On Linux, run perf record with call graphs enabled for 15-30 seconds under realistic load, then perf script to dump the samples. For Python, py-spy record or py-spy dump gives you equivalent data.
- Paste the stacks. Open the CPU Flamegraph Visualizer, paste either folded stacks or raw perf script / py-spy output into the input area, and render.
- Read the graph. Start at the bottom row — main or your runtime's entry point — and look upward: the widest towers are where samples concentrate, and the boxes above them show where those calls led.
- Zoom into hot frames. Click the widest suspicious frame; its subtree expands to full width, and leaf functions like a hot regex_exec become obvious.
- Act on the widest boxes. Cache a result, hoist work out of a loop, fix the pattern, batch the calls — then re-profile to confirm the box actually shrank.
Reading a Flame Graph Without Fear
Flame graphs look intimidating until someone states the rules. After that, they are the friendliest performance chart there is.
The x-axis is not time. It is the proportion of samples. If handleRequest spans 40% of the width, it was on the stack for roughly 40% of the samples in the capture. Frames are sorted alphabetically within each level, not chronologically, so never read the graph left to right as a timeline.
The y-axis is call depth. Each row is one frame deeper. The bottom row is the root of every stack — often main — and each layer above shows what that frame called. A tall tower means a deep call chain; the box at the top is the leaf, the function actually running when the sample was taken.
Width is cost. The most useful sentence in flame graph reading: the widest frame consumed the most CPU. A wide box with many children spreads its cost across callees; a wide box with one huge child points at a single expensive call site.
Zoom and search are essential. In a full-width view, important frames can be a few pixels wide. Click a frame to rescale its subtree, and search by name — type gc and you instantly see what fraction of samples went to garbage collection.
The folded format is simple. Each line is one aggregated call path: frames joined by semicolons, a space, then the sample count — main;handleRequest;parseQuery;regex_exec 87 means 87 samples followed exactly that stack. The visualizer reads this directly and also folds raw perf script and py-spy output into the same shape for you.
About icicle orientation. Some tools draw the graph growing downward from the top — an "icicle" view. The classic flame graph grows upward. The semantics are identical either way; just check the direction before narrating "up the stack" in a meeting.
Practical Use Cases
Finding a Hot Regex
Profile an API service and a suspiciously wide regex_exec frame appears under parseQuery, eating a third of all samples. Zoom in, confirm the call path, then take the pattern back to your code — it is usually a nested quantifier or a pattern recompiled on every request. Precompile or simplify it, and verify the frame shrinks in the next capture. To compare candidate patterns safely first, run them through the Regex Performance Tester linked below.
Diagnosing GC Pressure Through gc Frames
Search for gc in a Python or JVM profile and the graph shows both how much CPU the collector burns and which call paths allocate the most. Wide towers ending in allocation functions reveal hot spots that create throwaway objects: copying large structures per request, concatenating strings in loops, or deserializing whole payloads for a few fields. Cut the allocations, watch the gc share shrink, and prove it with a second profile.
Comparing Before and After an Optimization
Flame graphs make optimization measurable. Capture a profile, save the per-function totals, make your fix, then capture again under the same load. The widest frames should visibly shrink, and you get numbers for the changelog: "parseQuery dropped from 31% to 4% of samples." Without the second capture you are guessing; with it, you have evidence.
Teaching Performance Thinking
Because the tool needs no installation, it is ideal for teaching. Hand a junior engineer a deliberately slow program, have them capture a profile, and let them explore: predict where the time goes, then check the graph. Learning that "widest box first" beats intuition is a career-long lesson, and an interactive graph makes it stick.
Best Practices
- Profile under realistic load. A profile of an idle service describes your profiler, not your bottleneck. Reproduce production-like traffic first.
- Capture long enough. A few seconds is noise; 15-60 seconds under load gives frame widths meaning.
- Hunt plateaus, not spikes. Consistent wide frames that appear in every capture are the real cost drivers; one-off blips rarely matter.
- Confirm fixes with a second capture. Profile, fix, re-profile under the same conditions. The pair of graphs is your proof.
- Search before you conclude. Type gc into the search box before declaring garbage collection innocent; narrow frames can still add up.
- Keep your captures. A dated folder of folded stacks is a performance history your future self will thank you for.
Next time a service runs hot, skip the tooling yak-shave. Open the CPU Flamegraph Visualizer, paste your stacks, and let the widest box tell you where to look. Profiling should be a habit rather than a last resort — and with nothing to install, there is no excuse left.
Related Tools You Might Like:
- Regex Performance Tester — benchmark regex patterns before they reach your hot path.
- Log Viewer — pair what the flame graph shows with what your logs recorded.
- Cron Gap Simulator — sanity-check the schedules driving your batch jobs.
Happy profiling!
Frequently Asked Questions
Q: Is my profiling data uploaded anywhere? A: No. Parsing, folding, and rendering all happen in your browser, so the stacks you paste never leave your machine — which matters because profiles often contain internal function and endpoint names.
Q: What input formats does it accept? A: Two kinds: already-folded stacks (semicolon-separated frames with a trailing sample count) and raw profiler output, specifically perf script output and py-spy output. Paste either and the tool handles the folding.
Q: My graph is a wall of tiny boxes. Where do I start? A: Click the widest frame on the bottom row to zoom. Zooming rescales that subtree to full width, turning unreadable slivers into readable boxes. If you already have a suspect, search by function name instead.
Q: Does it work for languages other than C and Python? A: Yes, as long as you can produce folded stacks or convert your profiler's output to that shape. Any sampling profiler whose stacks fit the frame;frame;frame count form — Go, Rust, Node.js, Java via async-profiler, and more — will render fine.