Graphviz DOT Renderer: Turn DOT Source Into SVG Diagrams in Your Browser
Graphviz DOT Renderer converts plain-text DOT descriptions into crisp SVG diagrams right in your browser, with an editable source panel, zoom and pan, and SVG/PNG export — all powered by the viz.js WebAssembly build with no server involved.
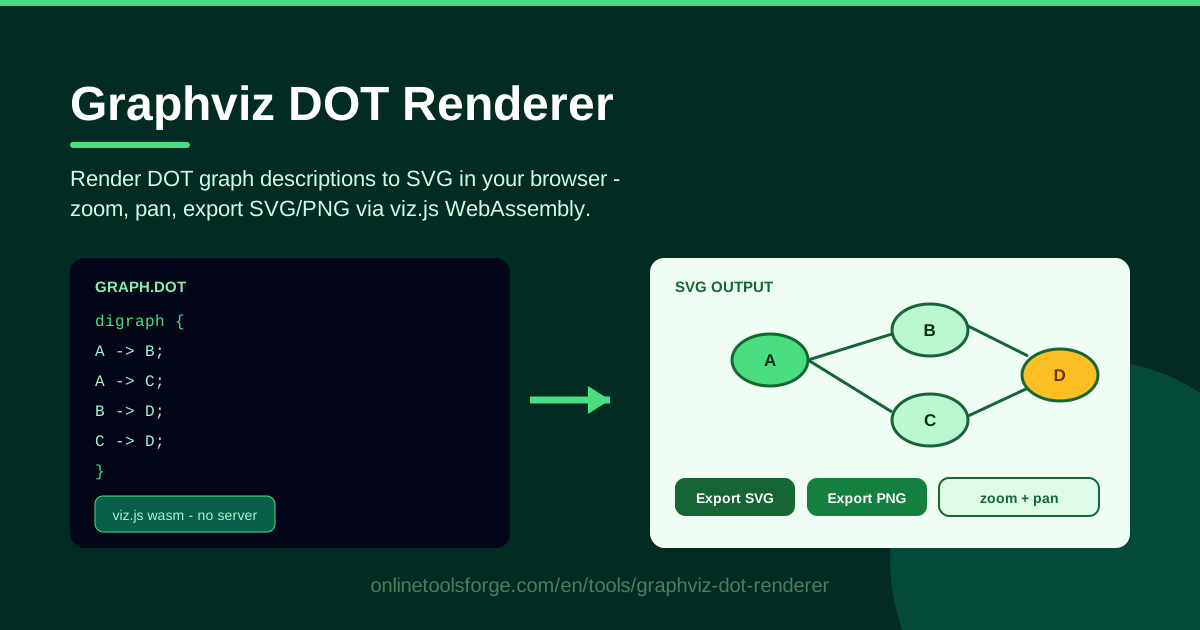
Table of Contents
Diagrams are the shared language of software teams, but drawing them by hand in a drag-and-drop editor is slow, fiddly, and rarely consistent. The Graphviz DOT Renderer takes a different approach: you describe your graph as plain text in the DOT language, and the tool renders it into a clean SVG diagram instantly. Because the layout is computed by the Graphviz engine instead of your mouse, every diagram you produce comes out tidy, aligned, and reproducible.
DOT is the graph description language behind the classic Graphviz toolset. You declare nodes, connect them with edges using the -> operator, and optionally decorate anything with attributes such as labels and shapes. A five-line digraph is enough to sketch a service architecture, a state machine, or a decision flow — and editing text is always faster than nudging boxes.
What makes this implementation special is that it runs the viz.js WebAssembly build of Graphviz entirely in your browser. Nothing is uploaded, nothing waits in a queue, and your DOT source never leaves the tab. That makes it a genuinely private, zero-install way to do graph visualization from any machine.
Why Use Graphviz DOT Renderer?
- No server, no uploads. The viz.js WebAssembly build runs the Graphviz layout engine locally, so proprietary architecture details or internal service names never travel over the network.
- Text beats mouse work. Describing a graph in DOT is faster, more precise, and easier to revise than repositioning shapes by hand, especially when the structure changes.
- Instant feedback loop. The editable source panel re-renders your diagram as you type, so you can iterate on structure and styling without reloading.
- Crisp, scalable output. The renderer produces SVG, which stays razor-sharp at any zoom level in wikis and README files.
- Portable results. Export as SVG for docs or PNG for slides, tickets, and chat apps where vector formats are awkward.
- Free and frictionless. No account, no install, no command line — open the page and start rendering graphviz online in seconds.
Key Features
| Feature | What it does |
|---|---|
| DOT source editor | Type or paste digraph, node, and edge statements in an editable source panel |
| Live SVG rendering | Renders your DOT description into an SVG diagram directly in the page |
| Zoom and pan | Inspect dense graphs comfortably by zooming in and panning across the canvas |
| SVG export | Download a vector version that remains sharp in docs, wikis, and print |
| PNG export | Grab a raster image sized for slides, issue trackers, and messaging apps |
| In-browser engine | Powered by the viz.js WebAssembly build, so rendering happens entirely client-side |
A few of these deserve a closer look. The editable source panel makes the DOT text the single source of truth — the diagram is always a faithful render of exactly what you wrote, which is why DOT files version so cleanly in git. Zoom and pan matter once your graph grows past a screenful, and because export supports both SVG and PNG, the same source can feed a wiki page today and a slide deck tomorrow.
How to Use Graphviz DOT Renderer
- Write your digraph source. Open the tool and type or paste your DOT description in the source panel, starting with digraph name { ... } and adding node and edge statements inside.
- Render the diagram. As soon as the source is valid, the tool renders an SVG diagram — nodes appear as shapes, edges as arrows, positioned automatically.
- Zoom and pan to inspect. Use the zoom and pan controls: magnify a cluster of nodes, follow an arrow across the canvas, or step back to see the whole graph.
- Tweak the source and re-render. Adjust labels, add shapes, insert or remove edges, and watch the SVG update to reflect every change.
- Export as SVG or PNG. When it looks right, export as SVG for docs or PNG for anywhere a static image is handier.
That loop typically takes well under a minute, which is why a dot to svg workflow fits so neatly into everyday developer work.
DOT Syntax Essentials
A DOT file starts with a graph declaration. digraph produces a directed graph whose edges are drawn with arrowheads — the right choice for flows, dependencies, and state transitions. graph produces an undirected graph whose edges use --, for relationships without a direction. Everything lives between braces.
Nodes are the entities in your graph, declared implicitly by mentioning them in an edge or explicitly with a statement like A;. Attach attributes in square brackets to control appearance: A [label="API Gateway", shape=box];. The label replaces the node identifier in the rendered output, and shape picks the geometry — box for components, ellipse for states, diamond for decisions, cylinder for data stores.
Edges connect nodes with -> in a digraph, and a single statement can chain: client -> gateway -> service; draws two arrows in one line. Edges accept attributes too — label puts text on the arrow (verbs like "calls", conditions like "retry"), while style=dashed and color change the line itself. Labels with spaces need quotes.
The part people underestimate is the layout engine. You never specify coordinates; the Graphviz algorithm reads your nodes and edges, measures the labels, and positions everything to minimize crossings and keep edge lengths readable. Add rankdir=LR and the whole diagram reorients left-to-right, often better for pipelines. This automatic positioning keeps hand-written DOT looking professional — the engine handles the aesthetics so you can focus on structure.
Practical Use Cases
Architecture and Dependency Diagrams
Sketch how the pieces of your system talk: browser to CDN, CDN to load balancer, load balancer to services, services to the database. Shape each tier differently, label the edges with protocols ("HTTPS", "gRPC"), and you have a one-screen architecture overview that stays accurate because it is regenerated from text. The same technique maps package dependencies — an arrow per import makes circular dependencies leap off the page.
State Machines
Directed graphs are the natural notation for state machines. Declare each state as a node, draw idle -> running and running -> failed edges, and put the trigger on each edge label ("start", "timeout", "retry"). Reviewers validate the transition logic at a glance, and updating after a code change is a one-line edit rather than a redraw.
CI/CD Pipeline Sketches
Before you commit a pipeline config, sketch it in DOT: lint -> test -> build -> deploy-staging -> approval -> deploy-prod. Parallel jobs become branches from a shared node, and edge labels carry conditions such as "on main only". A quick flowchart from dot notation is the cheapest way to spot a missing gate or a misordered step.
Teaching Data Structures
DOT is also a wonderful teaching aid. Linked lists, trees, and heaps render from a handful of lines, and changing the input immediately shows how the structure responds — insert a node into a binary search tree and watch the layout adjust. Because the tool runs in the browser, it works where installing software is not an option.
Best Practices
- Label every edge that matters. An unlabeled arrow forces readers to guess the relationship; a short verb or condition ("queries", "on failure") removes all ambiguity.
- Keep graphs under a dozen nodes per view. If a diagram grows crowded, split it into layered views — one overview, one detail graph per subsystem — instead of cramming everything into one render.
- Use shapes semantically. Reserve diamond for decisions, box for components, cylinder for storage, and stay consistent across diagrams so readers build a vocabulary.
- Export SVG for documentation. SVG scales cleanly in wikis and markdown, while PNG is better reserved for places that only accept raster images.
- Keep the DOT source next to the output. Commit the .dot text alongside the exported file so anyone can regenerate or revise the diagram later.
- Prefer rankdir over manual ordering tricks. rankdir=LR and a sensible edge set usually beat trying to force positions through node ordering.
Ready to see it in action? Open the Graphviz DOT Renderer, paste a small digraph, and export your first SVG in under a minute — no signup, no server.
Related Tools You Might Like:
- Regex Explainer — decode and test regular expressions piece by piece.
- jq Playground — filter and transform JSON with live jq queries.
- JSON Formatter — pretty-print, validate, and minify JSON instantly.
Happy diagramming!
Frequently Asked Questions
Q: Is my DOT source sent to a server?
A: No. The tool uses the viz.js WebAssembly build of Graphviz, so parsing and layout run entirely inside your browser; your graph description never leaves the page.
Q: What is the difference between digraph and graph in DOT?
A: digraph declares a directed graph whose edges use -> and render with arrowheads, fitting flows and dependencies. graph declares an undirected graph whose edges use --, fitting relationships without direction.
Q: Which export format should I choose, SVG or PNG?
A: Choose SVG for documentation and anywhere the diagram may be zoomed or printed, because it scales without quality loss. Choose PNG for slides, tickets, or chat tools that prefer raster images.