Linear Regression Calculator: Fit a Trend Line to Your Data
Paste X/Y data and get least-squares slope, intercept, R-squared, and the correlation coefficient with a scatter plot. Free linear regression, fully in your browser.
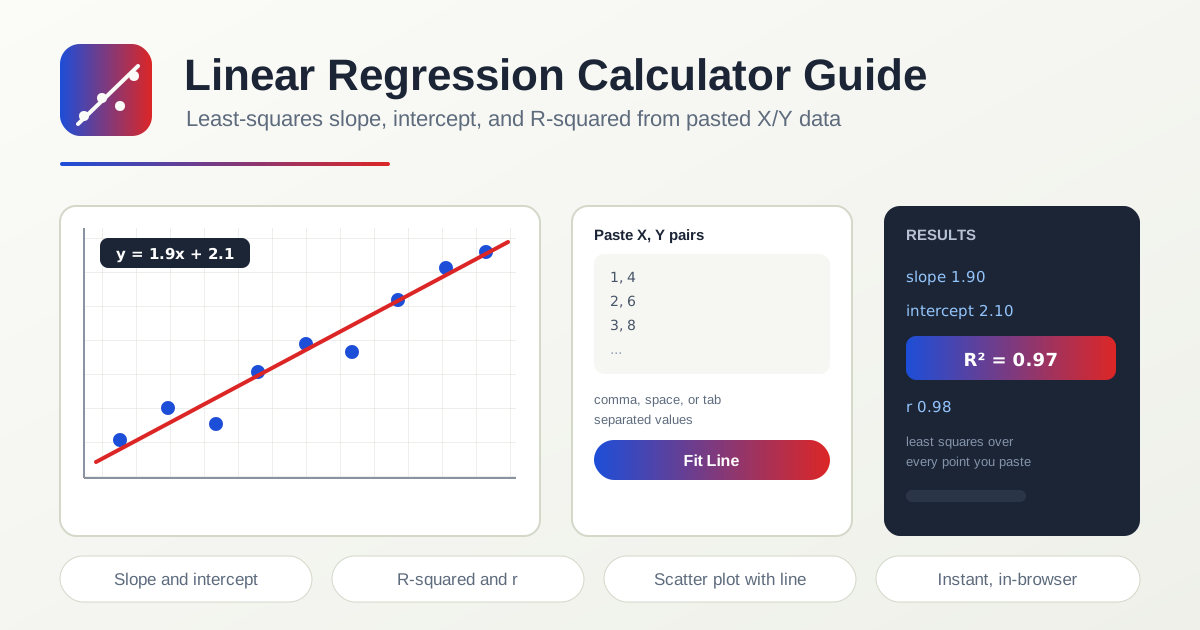
Table of Contents
Every dataset tells a story, but a raw scatter of points can be hard to read. A fitted trend line turns that scatter into a sentence: for every one-unit increase in X, Y changes by this much. The linear regression calculator builds that line for you in seconds. Paste your X/Y pairs and the tool returns the least-squares slope and intercept, the R-squared value, and the correlation coefficient, plus a scatter plot with the fitted line drawn on top.
Because the entire calculation runs in your browser, there is nothing to install, no account to create, and no data leaving your device. It is free, instant, and simple enough for a homework problem, yet accurate enough for a lab report or a sales review.
This guide walks through how the tool works, how to read its output, and where simple linear regression earns its keep in everyday analysis.
Why Use the Linear Regression Calculator?
- Instant results: Slope, intercept, R-squared, and the correlation coefficient appear the moment you paste data, so you can test ideas without waiting.
- Flexible input: Paste pairs separated by commas, spaces, or tabs, so data copied straight from a spreadsheet or textbook table works without cleanup.
- Complete output: You get all four numbers that matter for simple linear regression, not just a line equation.
- Visual confirmation: The scatter plot with the fitted line shows at a glance whether a straight-line model suits your data.
- Private by design: All computation happens in your browser, and your numbers never touch a server.
- Minimal data needs: Two points with distinct X values produce a line, which makes quick checks painless.
Key Features
| Feature | What it does |
|---|---|
| Flexible pasting | Accepts X/Y pairs separated by commas, spaces, or tabs |
| Least-squares fit | Computes the slope and intercept that minimize squared errors |
| R-squared | Reports the coefficient of determination, the share of explained variance |
| Correlation coefficient | Shows r, the strength and direction of the linear relationship |
| Scatter plot | Draws your points with the fitted line overlaid for visual checks |
- Input is forgiving: mixed separators and extra whitespace are handled, so a raw copy-paste usually just works.
- The tool requires at least two points with distinct X values, because identical X values cannot define a slope.
- Results update instantly in the browser, making it easy to edit a value and watch the line move.
How to Fit a Regression Line
- Collect your pairs. Gather each observation as an X value with its matching Y value, such as study hours and test scores.
- Open the calculator. Visit the linear regression calculator page in any modern browser.
- Paste your data. Drop the pairs into the input box, one pair per line, separated by commas, spaces, or tabs.
- Read the results. The tool immediately reports the least-squares slope and intercept, R-squared, and the correlation coefficient r.
- Check the plot. Scan the scatter plot to confirm the fitted line tracks your points and to spot outliers worth investigating.
Reading Slope, Intercept, and R-Squared
The model behind the tool is the familiar straight-line equation y = mx + b. In regression language, m is the slope, b is the intercept, and the calculator estimates both from your data with the least-squares method.
Least squares, in plain words, means the fitted line is placed so that the squared vertical distances between your points and the line are as small as possible. Squaring keeps positive and negative misses from canceling out and punishes large misses more heavily, which yields the single best line for the given data.
The slope (m) tells you how much Y changes when X increases by one unit. A slope of 3.5 in a model of ad spend versus revenue means each extra unit of spend is associated with 3.5 more units of revenue on average.
The intercept (b) is the predicted Y when X equals zero. Sometimes that is meaningful, such as a fixed starting cost. Other times zero sits outside the range of your data, so treat the intercept as an anchor for the line rather than a prediction.
R-squared measures explained variance: the share of the variation in Y that the line accounts for, on a scale from 0 to 1. An R-squared of 0.85 means 85 percent of the spread in Y is explained by X; the remaining 15 percent comes from other factors or noise.
The correlation coefficient (r) adds direction and strength. A positive r means the line rises, a negative r means it falls, and values closer to 1 or -1 indicate tighter fits. In simple linear regression, r is the signed square root of R-squared.
Paste three points like these and the tool returns the line shown:
1, 4.1
2, 5.8
3, 7.9
# fitted: y = 1.9x + 2.13, r = 0.998, R-squared = 0.996
One formatting note: the calculator needs at least two points with distinct X values. If every X is identical, no slope exists and no line can be fitted.
Practical Use Cases
Statistics Homework and Exams
Students use the tool to verify hand calculations. Work a least-squares problem with the formulas, then paste the pairs into the linear regression calculator to confirm your slope, intercept, and R-squared. Instant feedback catches arithmetic slips before they cost marks, and the scatter plot builds intuition for what a good fit looks like.
Sales Trend Forecasting
Paste monthly revenue against a month index to expose the underlying trend beneath seasonal bumps. A slope of 1,200 per month translates directly into a baseline growth rate, and R-squared tells you how much to trust that straight-line story before you extend it forward.
Science Lab Data
Calibration curves, cooling experiments, and reaction-rate studies all produce X/Y pairs that should follow straight lines. Fit the line, report the equation and R-squared in your write-up, and use the plot to flag any measurement that deviates from the trend.
Quality Control Checks
Track a measured property, such as fill weight, against machine settings or production hour. A stable relationship with strong R-squared helps you predict output, while a weakening correlation can signal process drift that deserves a maintenance look.
Best Practices
- Plot first, trust later. Look at the scatter plot; strong numbers on a curved cloud of points mean a line is the wrong model.
- Watch for outliers. Least squares is sensitive to extreme values, so a single bad reading can drag the whole line.
- Stay within your data range. Predictions far outside observed X values are extrapolations and can mislead badly.
- Use enough points. Two points always give a perfect-looking fit; more data makes the slope estimate meaningful.
- Report both R-squared and r. R-squared covers explained variance while r conveys direction, and together they describe the relationship fully.
- Correlation is not causation. A tight line shows association, not proof that X causes Y.
Ready to Fit Your Trend Line?
Whether you are finishing a statistics problem, sizing up a sales trend, or checking lab measurements, the linear regression calculator gives you slope, intercept, R-squared, and a fitted scatter plot in the time it takes to paste your data. Open the tool, drop in your pairs, and let the least-squares line do the talking.
Related Tools You Might Like:
- Statistics Calculator — for descriptive statistics such as mean, median, variance, and standard deviation.
- Average Calculator — quick means and totals for any list of numbers.
- Sample Size Calculator — plan surveys and experiments with the right number of observations.
Happy fitting!
Frequently Asked Questions
Q: How many data points do I need for a regression line?
A: The minimum is two points with distinct X values. In practice, aim for eight to ten pairs or more so the slope and R-squared reflect a real pattern rather than coincidence.
Q: What is the difference between R-squared and r?
A: R-squared is the proportion of variance in Y explained by X, while r is the correlation coefficient showing direction and strength. R-squared runs from 0 to 1; r runs from -1 to 1. In simple linear regression, r squared equals R-squared.
Q: Can I paste data directly from a spreadsheet?
A: Yes. The calculator accepts pairs separated by commas, spaces, or tabs, so a standard two-column copy-paste from Excel or Google Sheets works without reformatting.
Q: Does my data get uploaded anywhere?
A: No. All fitting and plotting happen locally in your browser, so nothing is sent to a server and no signup is required.
Q: What does a low R-squared mean?
A: It means X explains little of the variation in Y. The relationship may be nonlinear, other variables may matter more, or the data may simply be noisy.