Sample Size Calculator: How Many Visitors Does Your A/B Test Really Need?
Compute A/B test sample size per variant from baseline conversion rate, MDE, significance, and power with the free Sample Size Calculator. Runs entirely in your browser.
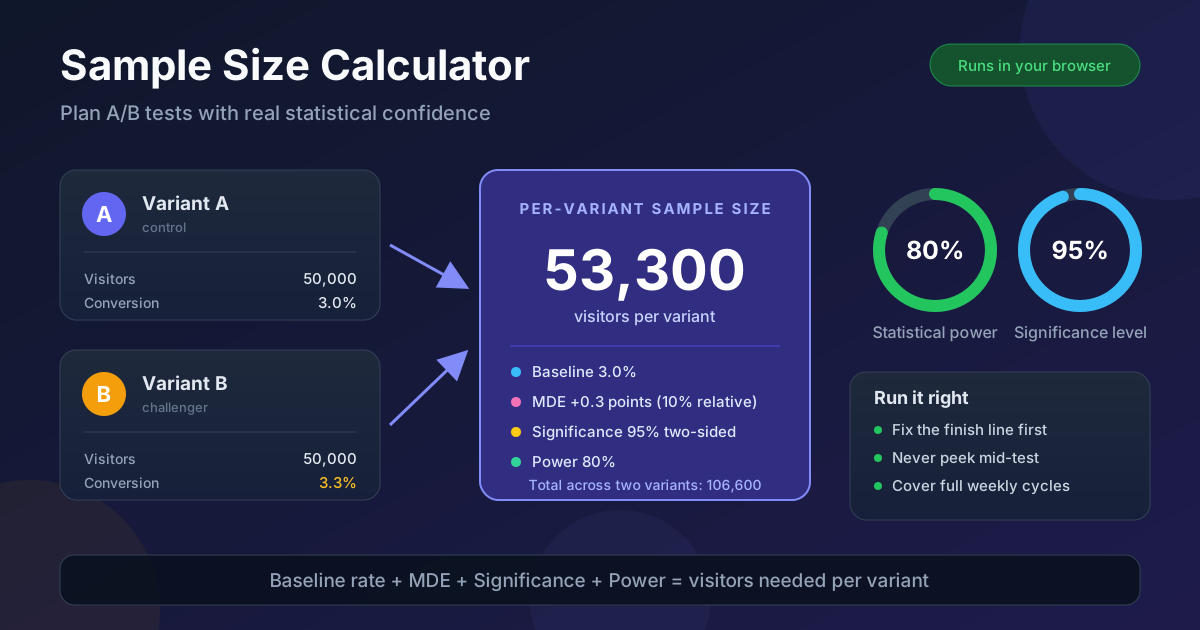
Table of Contents
Sample Size Calculator: How Many Visitors Does Your A/B Test Really Need?
Every team that runs experiments hits the same trap: the test has been live for four days, variant B is ahead, the p-value briefly dips below 0.05, and someone calls it. Stopping an A/B test the moment it "looks significant" is one of the most reliable ways to ship noise. The lift you celebrate is often just early randomness, and it quietly evaporates the week after launch.
The fix is unglamorous but powerful: decide how many visitors each variant needs before the test starts, then let it run until it gets there. That number depends on your baseline conversion rate, the smallest lift you care about detecting, and the risk of a wrong call you will accept. The free Sample Size Calculator turns those inputs into a concrete per-variant sample size in seconds, entirely in your browser.
This guide covers the four inputs that drive the calculation, a fully worked example, and the practices that separate trustworthy experiments from expensive coin flips.
Why Use Sample Size Calculator?
- Prevents premature "wins" that are really noise. A test stopped early because it looks significant has a badly inflated false-positive rate. A known sample size gives you a fixed finish line, so the data decides.
- Reveals whether an experiment is feasible at all. If detecting a 10% relative lift requires 210,000 visitors per variant but your page gets 4,000 a month, learn that in planning, not after three weeks of a stalled test.
- Turns "how long will this take?" into arithmetic. Divide it by daily traffic for a realistic, roadmap-credible duration.
- Balances speed against risk explicitly. Significance and power let you state in advance how often you will accept a false win or miss a real improvement.
- Avoids black-box guessing. Many platforms hide the math; computing it yourself keeps planning grounded in transparent statistics.
- Keeps sensitive data private. The calculator runs 100% client-side, so your conversion rates never leave your browser.
Key Features
| Feature | What It Does |
|---|---|
| Baseline conversion rate | Anchors the calculation to your current performance |
| MDE, relative or absolute | Enter the minimum detectable effect as a percent lift or in percentage points |
| Significance level | Choose 90%, 95%, or 99% confidence |
| One- or two-sided hypothesis | Match the design to your alternative hypothesis |
| Statistical power | Pick 80%, 90%, or 95% probability of detecting a real effect |
| Multi-variant support | Plan tests with more than one challenger, not just A versus B |
| Daily traffic estimate | Optional input converts sample size into an expected run time |
The relative/absolute MDE switch mirrors how teams actually talk — product managers say "a 10% lift", analysts say "0.3 percentage points", same goal — and every value updates live as you type.
How to Use
- Open the Sample Size Calculator. It loads instantly with sensible defaults and no sign-up.
- Enter your baseline conversion rate, measured on the exact page or flow you plan to test.
- Set the MDE and choose its type: relative (percent lift) or absolute (percentage points) — whichever matches how your team phrases the goal.
- Choose significance, hypothesis, and power. 95% significance, two-sided, and 80% power are the standard starting combination.
- Read the per-variant sample size. The tool supports more than two variants, and entering daily traffic shows the expected run time.
The Four Inputs That Decide Everything
Baseline conversion rate
This is the conversion rate of your control variant today. Detecting change gets harder as rates approach the extremes: nudging a 2% signup rate takes far more visitors than nudging a 40% add-to-cart rate by the same fraction. Measure it on the exact page and audience you plan to test, not a site-wide average.
Minimum detectable effect (MDE)
The MDE is the smallest true lift you want the test to detect, and it can be expressed two ways. Say your baseline is 3% and you want to detect an improvement to 3.3%. In absolute terms that is an MDE of 0.3 percentage points. In relative terms it is a 10% lift, because 3.3 is 10% more than 3.0 — same experiment, same sample size, just two dialects.
It is the most consequential input because sample size scales with the inverse square of the effect size: halve the MDE and you need roughly four times the visitors. In the example below, dropping the relative MDE from 10% to 5% raises the requirement from about 53,200 to about 207,900 per variant — which is why tiny MDEs are a luxury reserved for very high-traffic properties.
Significance level
The significance level (alpha) is your tolerance for a false positive — announcing a winner when the variants are actually equivalent; at 95%, a 5% chance. Two-sided is the safe default; one-sided buys a modest sample size reduction when you genuinely only care about improvement in one direction.
Statistical power
Power is the probability of detecting a lift that truly exists. At 80% power, one in five genuine improvements goes undetected. Raising power from 80% to 90% adds roughly 30% more visitors per variant — often worth it for high-stakes decisions.
A fully worked example
Suppose your checkout page converts at 3% and you want to detect a 10% relative lift (3.0% to 3.3%), with 95% significance, a two-sided hypothesis, and 80% power. The calculator returns roughly 53,200 visitors per variant, about 106,400 total for a simple A/B test. At 2,000 visitors per day per variant, plan for around four weeks. Change the MDE to a 20% relative lift and the requirement collapses to about 13,900.
Three caveats the calculator cannot fix
- Novelty effects. Early visitors react to change itself. Run full weekly cycles so returning users are represented.
- Peeking. Stopping at the first dip below 0.05 inflates false positives severely; the computed sample size is a commitment.
- Multiple comparisons. Five metrics or six variants multiply your chances of a fluke; pick one primary metric before launch.
Practical Use Cases
Product experiment planning
Before a sprint commits to a redesign, run the numbers: baseline, the lift that justifies the engineering cost, and your traffic. If the required sample size implies a two-month test, scope down the change or test on a higher-traffic surface first.
Email subject line tests
A 10% relative improvement on a 22% open rate is commercially meaningful, and the recipients needed per variant are comfortable for any list above a few thousand — one reason subject tests pay so well.
Pricing and packaging tests
Pricing changes produce small percentage-point shifts with large revenue consequences — low MDE, high stakes, exactly where rigorous planning earns its keep. Compute the sample size first; if it is out of reach, test packaging or presentation before price itself.
Marketing landing pages
Ad-driven pages get bursty, campaign-shaped traffic. Knowing the per-variant requirement tells you how many visits to accumulate before calling a winner instead of a "win" from one unusually good launch week.
Best Practices
- Decide the sample size before launch, in writing. A pre-registered finish line is the strongest defense against motivated reasoning.
- Resist peeking. If stakeholders demand interim reads, use a proper sequential testing method — not a raw p-value check.
- Run complete business cycles. Weekends, paydays, and launch spikes distort short tests; aim for one, preferably two, full weeks.
- Commit to one primary metric. Secondary metrics are for explanation, not for cherry-picking victory.
- Use your true baseline, measured on the exact page and audience rather than a site-wide average.
- When traffic is scarce, target bigger effects — a pragmatic MDE you can actually reach beats an ambitious one you never will.
Ready to Plan Your Next Experiment?
Open the Sample Size Calculator, enter four numbers, and know exactly what your next A/B test demands — free, instant, and entirely in your browser. Then dig deeper with the Statistics Calculator for descriptive summaries or the T-Test Calculator to analyze the finished experiment.
Related Tools You Might Like:
- Percentage Calculator — compute lifts, relative changes, and percentage-point differences by hand
- T-Test Calculator — evaluate whether your finished test reached significance
- Statistics Calculator — means, variance, and standard deviation for exploring your raw data
Happy experimenting, and may your lift be real!
Frequently Asked Questions
Q: What MDE should I choose for my A/B test?
A: Choose the smallest lift that would actually change your decision. If only a 15% relative improvement justifies the engineering cost, use 15%. Smaller values inflate the required sample size and may make the test impossible.
Q: Why does halving the MDE roughly quadruple the sample size?
A: Required sample size is proportional to one over the effect size squared. Halving the effect you want to detect divides the denominator by four, so the required visitors per variant grows about fourfold.
Q: Should I use a one-sided or two-sided test?
A: Two-sided is the default: it detects effects in either direction and matches how most platforms report results. Use one-sided only when a negative effect genuinely does not matter.
Q: Does the calculator account for multiple variants?
A: Yes. You can specify more than two variants, and the tool adjusts for the extra comparisons before reporting the per-variant sample size.
Q: Is any of my data uploaded to a server?
A: No. It runs 100% client-side; your baseline rate, traffic figures, and settings never leave your device.