GPX Track Analyzer: Read Your Activity Files Without Uploading
Parse GPX files for total distance, elevation gain and loss, duration, pace, and per-km splits with an elevation profile. Free and fully in your browser.
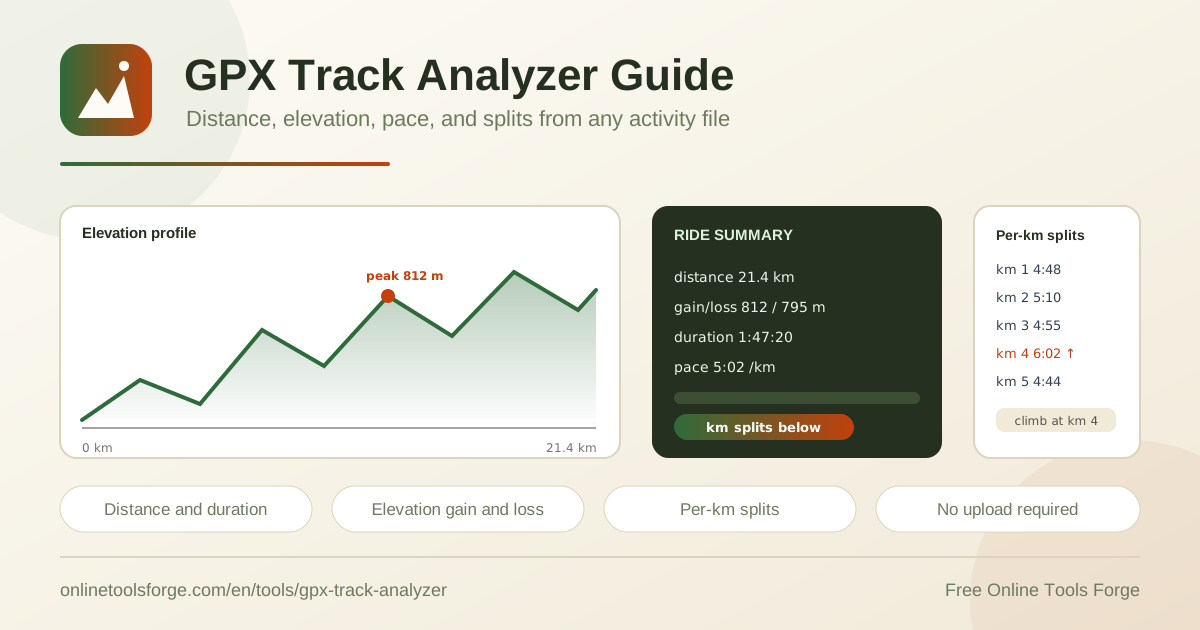
Table of Contents
Every modern sports platform speaks GPX. Garmin devices, Strava, Apple Watch, Coros, Polar, and most phone running apps can export your activities in this universal GPS exchange format. Open one in a text editor, though, and you see only a wall of XML coordinates. The GPX Track Analyzer turns that raw file into the numbers athletes actually care about — total distance, elevation gain and loss, duration, pace, and per-kilometer splits — in seconds, entirely in your browser.
Just drop a GPX file exported from your watch or phone app onto the page. The analyzer parses every trackpoint, accumulates the distance you covered, smooths the vertical movement into elevation gain and loss, and reads the timestamps to compute duration and average pace. It then builds a per-kilometer splits table and draws an SVG elevation profile that highlights the biggest climbs.
Because everything is parsed locally, the file never leaves your device. There is no upload, no account, and no waiting — just fast, private answers about the effort you put in.
Why Use the GPX Track Analyzer?
- Complete privacy by design. Parsing happens in your browser, so sensitive training data and location history never touch a server.
- No upload required. Large GPX files load instantly from your local disk instead of crawling through a network connection.
- Free and frictionless. No sign-up, no subscription, no watermarks — open the page and analyze as many files as you like.
- Works with any GPX source. Garmin, Strava, Apple Watch, Wahoo, Komoot, or a hand-edited file: if it is valid GPX, it works.
- Splits that tell a story. The per-kilometer table exposes exactly where you surged, faded, or hit a wall.
- Climbs made visible. The elevation profile flags the standout ascents so you can prepare for them next time.
Key Features
| Feature | What it does |
|---|---|
| Total distance | Accumulates point-to-point distances across every trackpoint in the file |
| Elevation gain and loss | Sums the smoothed ascents and descents along the route |
| Duration and average pace | Reads trackpoint timestamps to measure time and overall pace |
| Per-kilometer splits | Breaks the activity into a table of one-kilometer segments |
| Elevation profile | Draws an SVG area chart of altitude against distance |
| Biggest climbs | Highlights the hardest ascents so you can spot them at a glance |
| Local parsing | Processes the file on your device — nothing is ever uploaded |
Two details make these numbers trustworthy. First, distance is accumulated segment by segment rather than copied from a summary field, so the result reflects the actual geometry of your route. Second, the splits table and the profile are generated from the same underlying trackpoints, so their story is consistent — if kilometer 7 shows a slow split, the profile will usually show why.
How to Analyze a GPX File
- Export your activity. In Garmin Connect, Strava, Apple Fitness, or your sports app, open the activity and use the export or download option to save it as a .gpx file.
- Open the tool. Navigate to the GPX Track Analyzer in any modern browser, desktop or mobile.
- Drop in the file. Drag the .gpx file onto the drop zone, or use the file picker to browse to it. Parsing starts immediately.
- Read the summary card. Check total distance, elevation gain and loss, duration, and average pace at a glance.
- Dig into the details. Scan the per-kilometer splits for inconsistencies and study the elevation profile to see where the climbs live.
What the Numbers Mean
Trackpoints and distance. A GPX file records your position every second or two as a trackpoint containing latitude, longitude, elevation, and a timestamp. The analyzer walks this chain in order, computes the distance between each pair of consecutive points, and adds them up. Shorter recording intervals produce more points and a closer match to the path you actually traveled, which is why a 1-second recording setting yields more accurate totals than a smart-recording mode that thins the data.
Elevation gain versus loss. Raw barometric and GPS altitude data is noisy — a flat road can wiggle several meters between readings. Naively summing every upward wiggle would inflate the gain absurdly, so the analyzer applies smoothing before accumulating: sustained rises count toward gain, sustained falls count toward loss, and small jitter is ignored. Expect a fair representation of the work your legs did, not an inflated maximum.
Pace versus speed. Runners think in minutes per kilometer; cyclists think in kilometers per hour. The summary shows average pace derived from total duration divided by total distance. Remember that duration includes stops at traffic lights unless your device paused recording, so a trail-side break can drag the average.
Reading the splits for climbs. Compare consecutive splits against the elevation profile. A split two minutes slower than your average, aligned with a steep section of the chart, is terrain you handled — not a fitness problem. On rolling routes, splits let you separate effort from landscape.
The elevation profile view. The SVG chart plots altitude against distance, giving you an instant mental map of the route: where the long grind sits, where the steep punch hides, and how much descending recovery you earn.
Privacy through local parsing. Every calculation above happens in browser memory. A sample summary looks like this:
Distance:   21.4 km
Gain/Loss:  612 m / 598 m
Duration:   1:48:22  (5:04 /km)
Best split: km 3 — 4:41
Practical Use Cases
Reviewing a Training Run
After a tempo session, export the GPX and drop it into the analyzer. If your average pace looks slow, the splits table often reveals a single brutal kilometer — usually the hill you forgot you added to the route. Seeing that the rest of the run held steady turns a discouraging average into an encouraging session.
Scouting a Hiking Route
Downloaded a GPX of a trail from a hiking community? Check total distance and elevation gain before committing. A 14-kilometer route with 1,200 meters of gain is a completely different day than the same distance with 200. The profile shows whether the climbing is one long ascent or a series of rollers with recovery between them.
Comparing Bike Climbs
Export GPX files from two versions of your regular loop and compare their summary cards. One may show 450 meters of gain against 380 for a similar distance — objective evidence for why one route always hurts more. The biggest-climb highlights identify exactly which ascent got steeper.
Sharing Ride Summaries with a Coach
Coaches rarely need your raw location data. Instead of sending a full activity file to yet another service, open the analyzer and read off the key stats — distance, gain, duration, pace, and the standout splits — then paste them into your training log. The file stays on your machine; the insight travels.
Best Practices
- Export at the highest recording frequency your device allows for the most accurate distance and elevation figures.
- Confirm the activity actually recorded GPS — indoor treadmill sessions produce tiny files with no useful trackpoints.
- Read splits against the profile, not in isolation. Terrain context separates a real fitness signal from a single steep kilometer.
- Remember that pauses count. If you stopped for coffee without pausing the watch, duration and pace will reflect it.
- Analyze before you follow. Scouting an unfamiliar route file beats discovering a surprise climb at kilometer 30.
- Keep sensitive routes private. Since no upload occurs, you can safely inspect files containing home locations or secret trails.
Ready When You Are
Your activity files already contain everything you need to know. Open the GPX Track Analyzer, drop in a GPX file, and get distance, elevation, pace, splits, and a full gpx elevation profile in seconds — with the confidence that your data never left your device. It is free, instant, and built for runners, cyclists, and hikers who want answers without giving up their privacy.
Related Tools You Might Like:
- Running Pace Calculator — find the pace you need to hit a target time.
- Race Time Predictor — project race results from a recent effort.
- Heart Rate Zone Calculator — train in the right intensity zones.
Happy trails!
Frequently Asked Questions
Q: Is my GPX file uploaded to a server?
A: No. All parsing and calculation happen locally in your browser. The file never leaves your device, which makes the tool safe for routes that include your home, workplace, or private trails.
Q: Which devices and apps produce compatible GPX files?
A: Any tool that exports standard GPX works: Garmin, Strava, Apple Watch, Coros, Polar, Wahoo, Komoot, and many others. If your app can save or share an activity as a .gpx file, the analyzer can read it.
Q: Why do the elevation numbers differ slightly from my watch or Strava?
A: Elevation depends on smoothing choices and altitude sources. GPS altitude, barometric data, and elevation corrections each treat noise differently, so small differences between platforms are normal. Relative comparisons, such as which of two loops has more climbing, remain reliable.
Q: Does the tool work for cycling and hiking, or only running?
A: It works for any GPX track — running, cycling, hiking, or ski touring. Distance, elevation, duration, and splits are meaningful for all of them. Since parsing happens entirely in your browser, the analysis also works offline once the page is loaded.