HAR File Analyzer: Read Your Network Waterfall Like a Performance Engineer
Turn any .har capture from browser DevTools into a request waterfall, slowest-request ranking, status-code breakdown, and total transfer size — analyzed entirely client-side with HAR File Analyzer.
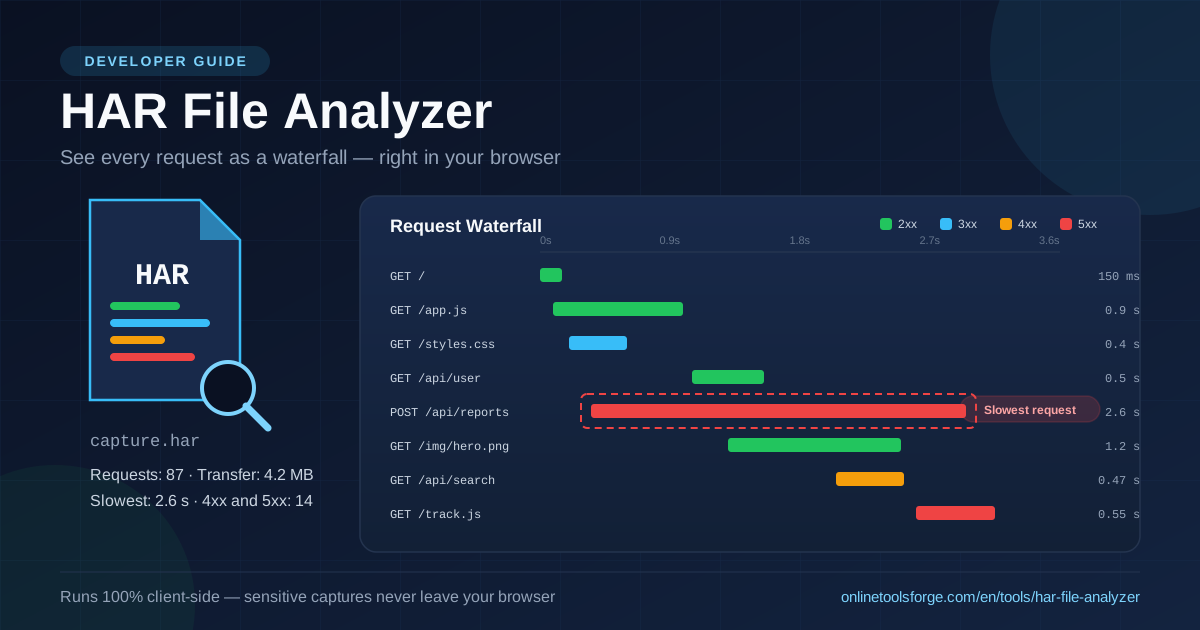
Table of Contents
HAR File Analyzer: Read Your Network Waterfall Like a Performance Engineer
When a page feels slow, the browser already knows why — the evidence sits in its network panel, scattered across dozens of rows. A HAR (HTTP Archive) file is a standardized JSON snapshot of that activity: every request, its timing phases, its status code, and its size. The HAR File Analyzer turns that raw capture into a request waterfall, a slowest-requests ranking, a status-code class breakdown, and a total transfer size figure within seconds.
Capturing one takes no special software. Open DevTools with F12, switch to the Network tab, reload the page, then right-click the request list and choose "Save all as HAR". That single file is the complete story of how your page was assembled.
What makes this tool different is where the analysis happens: entirely in your browser. HAR captures are sensitive — full of cookies, tokens, and internal URLs — and with this analyzer nothing is ever uploaded, so captures from internal dashboards and authenticated flows are safe to inspect.
Why Use HAR File Analyzer?
- Zero installation. No CLI, no desktop app — if you have a browser, you can analyze a HAR file right now.
- Nothing leaves your machine. Parsing runs 100% client-side — HAR files routinely contain session cookies, API keys, and personal data.
- Instant triage. The waterfall and the top-five slowest-requests ranking point you at the bottleneck before you read a single line of JSON.
- Failure detection at a glance. The status-code breakdown (2xx, 3xx, 4xx, 5xx) exposes broken assets, failed API calls, and server incidents a plain performance score never shows.
- Weight awareness. Total transfer size tells you whether the page is slow because it is heavy, not just because something responded late.
- Shareable evidence. Export the analysis as CSV or text summary and attach it to a ticket so everyone argues from the same numbers.
Key Features
| Feature | What It Shows |
|---|---|
| Request waterfall | Staggered bars showing when each request started and how long it took |
| Slowest requests | Top requests ranked by duration — the bottleneck named first |
| Status-code breakdown | Counts per class — 2xx success, 3xx redirect, 4xx client error, 5xx server error |
| Total transfer size | Combined capture size, useful for page-weight budgets |
| CSV and summary export | Machine-readable output for tickets, spreadsheets, or dashboards |
A few details worth knowing:
- Two ways in. Drag and drop a .har file, or paste the HAR JSON directly — handy when a colleague sends the text instead of the file.
- Readable at scale. Large captures are summarized so the waterfall stays legible, while aggregate statistics cover every entry, not just displayed rows.
How to Use
- Capture the HAR file. In Chrome, Edge, or Firefox: open DevTools, go to the Network tab, enable "Disable cache", reload the page, then right-click the request list and select "Save all as HAR".
- Open the analyzer. Visit HAR File Analyzer and drag your .har file onto the upload area, or paste the JSON into the input field.
- Read the overview. Check total requests, the status-code breakdown, and total transfer size to grasp the capture in five seconds.
- Scan the waterfall. Look for long bars and gaps; the slowest-requests ranking tells you exactly which entries deserve attention.
- Export and act. Download the CSV or copy the text summary into your issue tracker, then fix what the data points to — a slow endpoint, an oversized asset, or a failing request.
Reading a Waterfall Like a Performance Engineer
Waterfall anatomy. Every bar decomposes into phases: queueing (the browser delayed it), DNS, TLS, TTFB (waiting for the first byte), and download (receiving the body). The HAR timings object records each phase, so a single bar tells you where time went, not just that time was spent.
Long TTFB versus long download. Long TTFB means the server or network delayed the first byte — check backend queries, origin performance, cold starts, and redirects. Long download means the response arrived promptly but the payload is big or the connection slow — check compression, image weight, and CDN caching instead.
Status-code class diagnostics. A spike of 4xx almost always means broken references: assets that 404 because a build dropped them, 401/403 from expired sessions or missing permissions, or 429s from rate limits. A cluster of 5xx points at a server-side incident. Heavy 3xx traffic means redirect chains, and each hop adds a full round trip before the real content loads.
Transfer-size hotspots and caching. Sort mentally by weight: if a few images or bundles dominate the total transfer size, compression, modern formats, or lazy loading will pay off there. If a large asset re-downloads on every page load, its cache headers are probably missing — one server-side fix that saves every visitor the repeat cost.
A mini walkthrough. Picture a typical slow page. The HTML arrives in 300 ms — fine. The app.js bundle takes 900 ms at 1.8 MB uncompressed. Then POST /api/reports sits in TTFB for 2.6 seconds and returns 500: that endpoint is the bottleneck, failing outright. A tracking script 404s behind an ad blocker, and a 404 on /api/search reveals a removed endpoint still referenced in code. One waterfall, four findings — no guesswork involved.
Practical Use Cases
Support Tickets: Ask for a HAR
"Your site is slow" is impossible to debug; a HAR file is not. Asking users to reproduce the issue once with the Network tab open and send the capture turns a vague complaint into precise data — exact requests, timings, and failures from their actual network and device. Since the analyzer runs client-side, users know the capture never leaves their machine.
Debugging Third-Party Scripts
Analytics tags, chat widgets, and ad scripts are notorious for dragging pages down. Capture a HAR with and without the third-party host blocked, and the slowest-requests ranking will name the offender with exact timings — evidence for the vendor instead of a hunch.
Pre- and Post-Optimization Comparisons
Before optimizing, capture a baseline HAR. After bundling, compressing images, or adding a CDN, capture again under the same conditions, then compare total transfer size, 4xx/5xx counts, and the slowest requests side by side. Two captures beat any opinion.
API Latency Reports
Product managers and backend teams rarely want a raw network dump. A summary of the slowest endpoints, grouped by host and duration, gets performance work prioritized — export it from the analyzer and paste it straight into the ticket.
Best Practices
- Strip sensitive headers and cookies before sharing. HAR files can contain Authorization headers, Set-Cookie values, and tokens — redact them with a text editor before sending a capture outside your team.
- Capture on a clean profile. Use an incognito window with "Disable cache" enabled so extensions and stale caches do not distort the timings.
- Note the network conditions. Record whether you were throttled, on a VPN, or on mobile data — fast-fiber captures look nothing like your users' reality.
- Compare like-for-like: same page, same cache state, same network profile — otherwise the comparison is noise.
- Keep captures focused. Filter the network log to the domain you care about so the HAR stays small and readable.
- Capture twice when it matters. One capture is a sample; two consistent captures are evidence. If the same request is slow in both, you have a real finding.
The next time someone says "the site feels slow", do not start guessing. Open DevTools, save a HAR, and drop it into the HAR File Analyzer. Within seconds you will know whether the problem is a slow server, a heavy page, or a failing request — and the waterfall shows the rest of the team, too.
Related Tools You Might Like:
- HAR to cURL Converter — replay any request from a capture as a ready-to-run cURL command
- JSON Formatter — pretty-print and inspect the raw HAR JSON when you need entry-level detail
- URL Parser — break down the long query strings that often hide in capture URLs
Happy analyzing — may every waterfall end in a green bar!
Frequently Asked Questions
Q: Is my HAR file uploaded to a server?
A: No. Parsing and visualization happen entirely in your browser — the file, including any cookies or tokens inside it, never leaves your machine.
Q: What exactly is a HAR file?
A: HAR stands for HTTP Archive: a JSON file recording every request a page made, with timings, status codes, headers, and sizes. All major browsers export it from the Network tab of DevTools.
Q: How do I capture a HAR file?
A: Open DevTools (F12), go to the Network tab, reload the page, then right-click the request list and choose "Save all as HAR".
Q: Is a 4xx response the same as a 5xx response?
A: No. 4xx means the client made a bad request — missing asset, expired session, blocked resource. 5xx means the server failed to handle a valid request — the status-class breakdown separates them so you know which side to investigate.