Height Comparison Chart: See Who Is Taller at True Scale
Use the Height Comparison Chart tool to draw up to 8 people or objects to scale on a shared height chart with silhouette bars, gridlines, and PNG export.
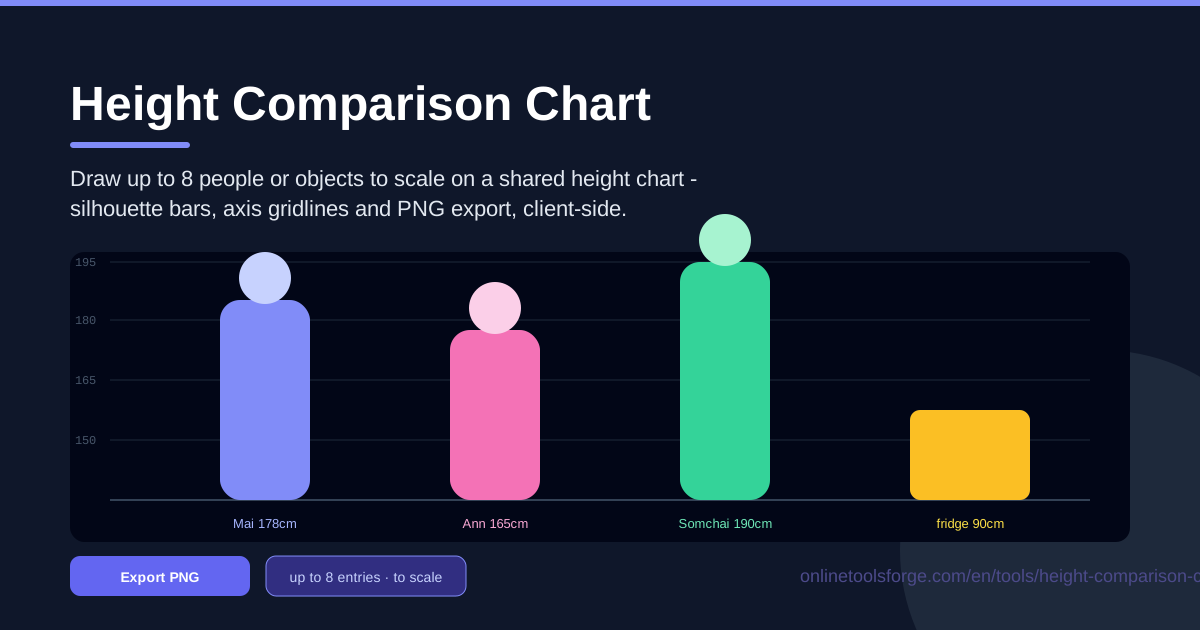
Table of Contents
Ever been stuck in a family debate about who is actually taller? Numbers alone rarely settle it — the brain does not turn "178 centimeters" into a picture very well. What answers the question is an image: figures side by side at the same scale.
That is precisely what the Height Comparison Chart on Online Tools Forge delivers. Add up to eight people or objects, enter their heights, and the tool draws every entry to scale on a shared height chart with silhouette bars and labeled gridlines. One click exports it all as a PNG image.
This guide covers how the tool works, why to-scale pictures beat raw numbers, and where a height comparison chart earns its place.
Why Use Height Comparison Chart?
- Instant visual answers. No more juggling centimeters, inches, and math — you see the gap between two heights the moment the bars render.
- People and objects together. You are not limited to humans. Add a fridge, a door, a dog, or a bookshelf and see how a person stacks up.
- Honest, to-scale drawing. Every silhouette is proportionally rendered against a shared axis, so the picture tells the truth.
- No sign-up, no install. The tool runs entirely in your browser. Nothing to download, no account to create, no waiting.
- Shareable PNG export. One click saves your chart as an image for a group chat, slide deck, or school project.
- Private by design. Because all rendering happens client-side, your measurements and names never leave your device.
Key Features
| Feature | What it does |
|---|---|
| Up to 8 entries | Add as many as eight people or objects, each with its own height |
| Shared height chart | Every entry is drawn against one common axis, keeping comparisons fair |
| Silhouette bars | Each entry appears as a filled silhouette bar sized to its real height |
| Axis gridlines with values | Labeled gridlines let you read any figure's height straight off the chart |
| PNG export | Download the finished chart as an image for sharing, printing, or archiving |
| Client-side rendering | All drawing happens in your browser with no server round-trips |
Three of these deserve a closer look:
- The shared axis is the whole trick. Two separate drawings cannot be compared, but every entry here is measured against the same gridlines — that is what makes the comparison valid.
- Silhouette bars stay readable. Eight figures could become clutter, but the solid silhouette style keeps the chart clean even when full.
- The exported PNG explains itself. The download preserves gridlines and values, so the image makes sense to anyone who never opened the tool.
How to Use Height Comparison Chart
- Add your entries. Open the tool and add up to eight people or objects, each with a short name so the bars are easy to tell apart.
- Set the heights. Type a height value for every entry. Real measurements work best — a wall pencil mark, a doctor's chart, or a product spec sheet.
- Mix people and objects. Combine humans with things: a person beside a fridge, a child beside a door, a pet beside its owner — all on the same scale.
- Read the scale. Use the axis gridlines and printed values to judge each figure — they act as an honest ruler up the side of the chart.
- Export the PNG. When the chart looks right, hit export and save the PNG before you close or refresh the page.
Why Scale Pictures Beat Numbers
Numbers are precise, yet poor at creating mental images. Tell someone a room is 240 centimeters wide and they nod; show them a person standing in it, drawn to scale, and they understand instantly. Closing the gap between precision and intuition is what this tool is built for.
Silhouette bars make differences obvious. When two figures share a baseline, even a few centimeters of difference jumps out. A five-centimeter gap nobody notices in conversation becomes unmistakable in a picture. Eyes are excellent at comparing lengths placed side by side, and silhouettes exploit that directly.
Gridlines act as an honest reference. Without a scale, a drawing can flatter anyone. The labeled gridlines anchor every figure to real values, so a viewer can check that the person labeled 180 centimeters really stands just above the 175 line. The chart shows a verifiable difference, not a claimed one.
Mixing people with objects adds context. Everyone has a rough sense of how tall a door, a fridge, or a kitchen counter is. Adding those objects gives viewers an anchor raw numbers never supply. How tall is your child compared to the refrigerator? Will that new bookshelf tower over you? A person-versus-object chart answers both in one glance.
The 8-entry limit is a design choice. Eight figures is about the most one chart can hold while staying readable. Beyond that, bars shrink, labels collide, and the comparison loses its punch. The cap keeps every chart sharp and useful.
Unit flexibility keeps it practical. Whether your family thinks in centimeters or feet, enter each height in the unit you measured it in; everything scales against one shared axis, so the picture stays correct.
Practical Use Cases
Family Growth Charts
Measure the kids against a wall every six months and rebuild the chart on each birthday. Watching a child's bar creep past a parent's shoulder — and eventually past their head — is a keepsake no spreadsheet can match. Export a PNG each year for a visual growth album. Comparing siblings, cousins, and grandparents on one chart makes reunions more entertaining, too.
Character Design Reference
Writers, comic artists, and game masters need to answer "how tall is this character next to that one?" Build the whole cast on a height chart — protagonist, rival, sidekick, towering villain — then export the PNG and pin it above your desk. Your cast will never silently change height between pages, whether it is an RPG party or a webcomic.
Furniture Fit Visualization
A refrigerator listed at 185 centimeters sounds manageable until you see it next to a 160-centimeter family member. Before buying a tall piece, plot the item, its user, and the ceiling height on one chart. The same trick covers wardrobes versus door frames and whether the top shelf will demand a step stool. A two-minute chart can prevent an annoying delivery-day surprise.
Classroom Measurement Fun
Teachers can turn a measurement lesson into the highlight of the week: students record their heights, add a familiar classroom object or two, and study the chart together. A giraffe at around 500 centimeters grabs attention instantly and anchors the concept of scale. The class watches numbers become a picture in real time — a better hook than any worksheet.
Best Practices
- Use real measurements wherever possible. A tape measure beats an estimate, and the chart is only as truthful as the numbers you feed it.
- Label every entry. "Dad — 178" reads far better than an anonymous bar, especially once the PNG circulates outside the tool.
- Sort tallest to shortest. This lets the eye sweep down a clean staircase instead of jumping around.
- Export before refreshing. A refresh clears your entries, so grab the PNG while the chart looks exactly right.
- Add one familiar object as an anchor. A door, a fridge, or a standard chair gives every viewer instant context.
- Keep one topic per chart. Resist cramming unrelated people and objects together; a focused chart tells a clearer story.
Ready to settle the great height debate once and for all? Open the Height Comparison Chart, add your people and objects, and export a to-scale picture in under a minute — no sign-up, no install, just an honest answer in your browser.
Related Tools You Might Like:
- BMI Calculator — pair height with weight for a quick body-mass snapshot
- Age Calculator — find out exactly how many days old anyone is
- Image Comparison Slider — compare before-and-after photos with a draggable slider
Happy comparing!
Frequently Asked Questions
Q: How many people or objects can I compare at once? A: Up to eight. The limit is deliberate — beyond eight bars, silhouettes shrink, labels crowd, and small differences become hard to see.
Q: Does the tool upload my measurements anywhere? A: No. The chart is rendered entirely client-side in your browser, so your heights, labels, and exports never leave your device.
Q: Can I mix people and objects on the same chart? A: Yes. A person beside a fridge, a child beside a door, or a pet beside its owner all draw on the same shared scale.
Q: How do I save or share my finished chart? A: Use the PNG export button. It downloads the full chart, gridlines and labels included, as an image you can post, embed, or print.