NPS Calculator: Measure Your Net Promoter Score Accurately and Read It Right
The NPS Calculator turns your Promoter, Passive and Detractor counts into a Net Promoter Score with percentage breakdown, quality band and 95% margin of error, entirely in your browser.
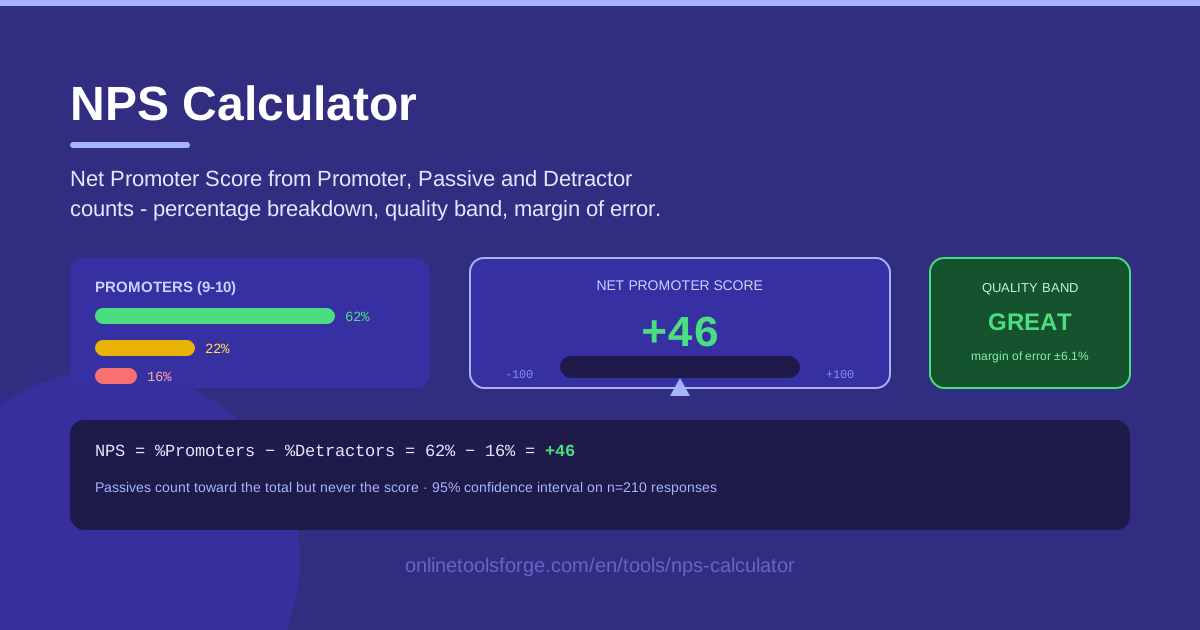
Table of Contents
Few metrics get quoted as often as the Net Promoter Score, and few get calculated as carelessly. Ask around any office how NPS is computed and you will hear three different answers, only one of which is right. The NPS Calculator ends the confusion: enter how many Promoters, Passives and Detractors responded to your survey, and it instantly returns the score, a full percentage breakdown, a quality band classification, and the margin of error at 95% confidence.
The tool is deliberately simple. There is nothing to install, no account to create and no data leaving your device — every calculation runs client-side in your browser. That makes it just as useful for a quick sanity check after a customer call as it is for a formal quarterly readout where the numbers need to be defensible.
A calculator, though, is only half the job. Knowing your score is +46 means little until you can interpret it. This guide covers the tool, the formula behind it, and the traps that catch even experienced teams.
Why Use NPS Calculator?
- No spreadsheet required. Tally your responses, type three numbers, and the result appears instantly — no formulas to build or break.
- Margin of error awareness. A +46 built on 30 responses is a different signal from a +46 built on 3,000. The calculator reports the 95% confidence margin alongside the score, so you never mistake sampling noise for a trend.
- The full picture, not just one number. You also get the percentage breakdown of Promoters, Passives and Detractors, which often explains a score better than the score itself.
- Instant quality band. The tool classifies the result into a band such as Great, turning a bare figure into a plain-language verdict.
- Zero arithmetic slips. The classic errors — dividing by the wrong base or forgetting that Passives still count in it — silently distort scores. The formula is applied correctly every time.
- Private and fast. All math happens client-side, so sensitive response counts never leave your machine.
Key Features
| Feature | What it does |
|---|---|
| Three-group input | Enter the raw counts of Promoter, Passive and Detractor responses from your survey |
| NPS score | Computes Net Promoter Score as % Promoters minus % Detractors, from −100 to +100 |
| Percentage breakdown | Shows the share of respondents in each of the three groups |
| Quality band | Classifies the score into a band such as Great for instant context |
| Margin of error | Reports the 95% confidence margin so you know how much to trust the number |
| Client-side math | Runs entirely in your browser — no sign-up, no uploads |
Two details deserve emphasis. The breakdown frequently tells the richer story: two teams can both post +30, yet one arrives there with a broad passive middle while the other is polarized between delighted promoters and angry detractors. And because the margin of error is computed at 95% confidence, you can immediately see when a two-point quarter-on-quarter "improvement" is well within noise — and when it is not.
How to Use NPS Calculator
- Tally your survey responses into the three groups. On the standard 0–10 scale, 9–10 are Promoters, 7–8 are Passives, and 0–6 are Detractors. Count how many responses land in each bucket.
- Enter the counts. Type the Promoter, Passive and Detractor totals into the three input fields.
- Read the NPS. The score appears immediately: percentage of Promoters minus percentage of Detractors.
- Check the quality band. Read the classification — for example Great — to translate the number into a verdict.
- Consider the margin of error. Before broadcasting the result, check the 95% confidence margin. With a small sample, treat the score as a range rather than a point.
The NPS Formula and Its Traps
The formula is disarmingly simple:
NPS = % Promoters − % Detractors
If 55% of respondents are Promoters, 25% are Passives and 20% are Detractors, the score is 55 − 20 = +35. The scale runs from −100, where every respondent is a Detractor, to +100, where every respondent is a Promoter. That simplicity hides several traps.
Passives are excluded from the score but counted in the base. The 7s and 8s appear nowhere in the arithmetic, yet they inflate the denominator. A passive-heavy survey drifts toward zero without a single detractor appearing. Some teams quietly drop Passives from the base to flatter the score; that breaks comparability with everyone else, so resist the temptation.
Bands are heuristics, not laws. The common reading is that below 0 needs improvement, 0 to +30 is fair to good, +30 to +70 is Great, and above +70 approaches world-class. The tool's quality band follows this convention, but cut-offs shift by industry and survey context. A +35 airline is not a +35 software vendor.
Small samples carry a wide margin of error. At 95% confidence, a proportion's margin is roughly 1.96 × √(p(1−p)/n). With 30 responses, a score of +46 can easily carry a margin near ±17 points, meaning the true value may sit anywhere between +29 and +63. At 300 responses the same score tightens to roughly ±6.
Benchmark culture can mislead. Published NPS benchmarks are rarely apples-to-apples: question wording, timing, channel and incentives all differ. A trend measured consistently inside your own program is worth more than a crossing against someone else's number.
Practical Use Cases
Quarterly Customer Survey Readout
Close the quarter with 320 relationship-survey responses: 176 Promoters, 96 Passives, 48 Detractors. The calculator turns that into 55% − 15% = +40, banded Great, with a margin of error of about ±5 points — solid enough to report. Set it against last quarter's +34 and you have a defensible trend line for the leadership deck, not just a lone number.
Support Team Quality Tracking
Post-ticket surveys are natural NPS fodder, but per-team samples are small. A team with 25 responses and a +52 may carry a margin near ±19 points, so resist ranking teams on the raw score alone. Track each team's band and margin over several weeks and treat a band change that persists across three cycles as the real signal.
Product Launch Feedback
Survey early adopters two weeks after launch and enter the counts. A rising Detractor percentage against the pre-launch baseline tells you onboarding is hurting, while a swelling Passive middle suggests the product works but fails to excite. The breakdown and band together point at which backlog items deserve the next sprint.
Investor and Board Reporting
Boards like one consistent number per period. Report NPS alongside its margin of error and response count, keep the survey instrument identical between periods, and note any methodology change explicitly. That discipline turns a vanity metric into a credible governance signal.
Best Practices
- Track the trend, not a single number. Direction over several quarters matters more than the level in any one of them.
- Read the verbatims alongside. The score tells you what; the comments tell you why. Never present one without the other.
- Size the sample honestly. If the margin of error is wider than the change you are celebrating, collect more responses before drawing conclusions.
- Segment by customer type. Enterprise accounts, self-serve users and long-tenured customers often hide opposite stories inside one blended score.
- Keep the question and scale identical over time. Changing wording mid-year resets your trend line to zero.
- Close the loop with Detractors. A fast, human follow-up to unhappy respondents is the highest-leverage action the score can trigger.
Ready to turn this quarter's responses into a number you can defend? Open the NPS Calculator, enter your three counts, and you will have the score, the breakdown, the band and the margin of error before your coffee cools.
Related Tools You Might Like:
- Percentage Calculator — for the percentage splits behind every metric you report.
- Sample Size Calculator — to decide how many responses your survey really needs.
- Average Calculator — for mean scores when you also track satisfaction ratings.
Happy measuring!
Frequently Asked Questions
Q: What is a good NPS score? A: Anything above 0 means you have more Promoters than Detractors, and scores from +30 to +70 are generally considered Great, with +70 and above approaching world-class. The right comparison, however, is your own trend over time rather than a published benchmark.
Q: Why are Passives excluded from the NPS formula? A: The formula measures the balance of strong sentiment, so only 9–10 scores and 0–6 scores enter the arithmetic. Passives are not ignored, though — they still count in the base and typically dilute the score toward zero.
Q: How many survey responses do I need before trusting the score? A: There is no magic number, but smaller samples carry wider margins of error. Around 30 responses the margin can approach ±17 points, while near 300 it tightens to roughly ±6. Check the margin the calculator reports and treat small samples as ranges.
Q: Can NPS be negative, and what does that mean? A: Yes. A negative score means Detractors outnumber Promoters, so dissatisfaction is the dominant experience. It is alarming but actionable: the percentage breakdown and your verbatims will show where the pain is concentrated.