T-Test Calculator: Tell Real Differences From Random Noise
Run one-sample, independent two-sample (Welch), and paired t-tests free in your browser and get the t statistic, p-value, degrees of freedom, effect size, and 95% confidence intervals in seconds.
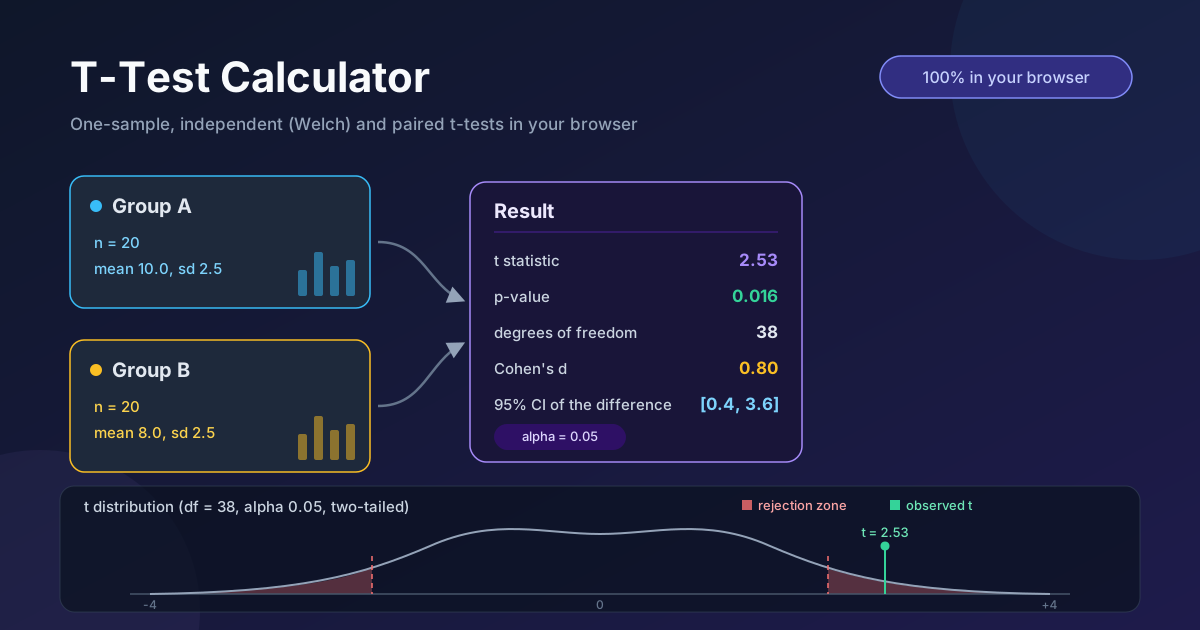
Table of Contents
T-Test Calculator: Tell Real Differences From Random Noise
Version B of your checkout page averaged 42.80 per order against 40.10 for version A. Looks like a win — but is it real, or did chance hand you a flattering sample? Intuition is bad at this, which is why the t-test exists: it weighs the difference against the noise and says how surprised to be if nothing were going on.
The free T-Test Calculator gives the standard statistical answer in seconds, entirely in your browser. It runs the three most common variants — one-sample, independent two-sample (Welch), and paired — and reports the t statistic, p-value, degrees of freedom, Cohen's d, and a 95% confidence interval. Every calculation happens on your device, so sensitive measurements never leave it.
This guide explains when each variant fits, how to read every number it reports, and the habits that keep conclusions honest.
Why Use T Test Calculator?
- No installs or sign-ups. Open the page in any modern browser — free, no sign-up, no limits.
- All three t-tests in one place. One-sample, independent two-sample (Welch), and paired are a single click apart.
- Effect size, not just significance. Cohen's d and a 95% confidence interval sit alongside the p-value.
- Your data never leaves the device. Computation is 100% client-side — safe for proprietary data.
- Forgiving data entry. Paste space-, comma-, or newline-separated values; bad tokens are flagged, not dropped.
- Adjustable significance level. Switch alpha between 0.01, 0.05, and 0.1 to match your standard.
Key Features
| Feature | What it does |
|---|---|
| Three test types | One-sample, independent two-sample (Welch), and paired |
| Complete output | t statistic, p-value, degrees of freedom, Cohen's d, 95% CI |
| Significance levels | Alpha 0.01, 0.05, or 0.1 |
| Client-side computation | All math in the browser — zero uploads |
| Tolerant input | Accepts mixed separators, flags bad tokens |
- Two-sample mode applies Welch correction by default, so unequal variances or group sizes will not distort the p-value.
- The interval comes from the same computation, so magnitude and significance tell one consistent story.
How to Use
- Open the tool and pick a test type. One-sample for a group versus a known target, two-sample for unrelated groups, paired for before-and-after designs.
- Paste the data for each group. Separate values with spaces, commas, or new lines; keep paired rows in matched order.
- Set the reference value (one-sample). For a line calibrated to 250 ml, enter 250.
- Choose your significance level. Keep 0.05 for most work; tighten to 0.01 when errors are costly.
- Read the output panel. The t statistic, p-value, degrees of freedom, Cohen's d, and interval appear with a plain verdict.
Which t-test and What the Output Means
The three tests and when each fits
The one-sample t-test compares a group mean to a fixed reference: does this machine really fill 500 ml bottles? The independent two-sample t-test compares two unrelated groups; the tool uses Welch's version, which does not assume equal variances and is the safest default. The paired t-test handles before-and-after measurements on the same subjects; subtracting pairs removes noise and adds power.
Reading t, p, and degrees of freedom
The t statistic is a signal-to-noise ratio: the difference divided by its standard error. The p-value asks how often random sampling would produce a difference at least this large if none existed; below your alpha it is conventionally significant. Degrees of freedom (df) track the sample's information — smaller df means fatter tails and larger p-values for the same t.
Cohen's d: how big is the effect?
Cohen's d expresses the difference in standard-deviation units, with classic benchmarks of 0.2 small, 0.5 medium, and 0.8 large. Significance and importance differ: a huge sample can make a trivial difference significant, while an important effect in a small pilot may miss the cutoff. Read d next to p.
Confidence intervals versus p-values
The 95% confidence interval shows the range the data consider plausible for the true difference; if it straddles zero, no difference cannot be ruled out. It also conveys precision: [0.4, 3.6] is meaningful, while [-0.1, 30.0] means the experiment was too noisy to conclude anything.
A worked example
A coffee machine is rated to dispense 250 ml a cup. Eight sampled cups read 248, 251, 247, 250, 246, 252, 249, 253 — mean 249.5, standard deviation near 2.45. One-sample mode returns t = -0.58, df = 7, p = 0.58, Cohen's d = 0.20, and an interval of [247.5, 251.5], which contains 250: no evidence of a meaningful misfill. For a two-sample case — twenty measurements per group, means 10.0 and 8.0, standard deviations 2.5 — Welch's test gives t = 2.53, df = 38, p = 0.016, d = 0.80, and an interval of [0.4, 3.6]: significant and large by Cohen's benchmarks.
Assumptions to keep in mind
The t-test assumes independent observations and roughly normal data — or normal differences for paired tests. Moderate skew with twenty-plus observations per group is rarely a problem; heavy skew, outliers, or count data call for a different approach. A quick histogram first is cheap insurance.
Practical Use Cases
Validating A/B test results beyond sample size
The Sample Size Calculator tells you how many visitors you need; once data is in, analysis matters. For continuous outcomes such as revenue per visitor or time on page, the Welch t-test turns a raw gap into a defensible verdict.
Before-and-after training studies
An office measures productivity before and after a training course. The same people are measured twice, so the paired t-test is correct — it controls for employees who were already high performers and isolates what the course produced.
Comparing lab or instrument measurements
Quality labs use the one-sample t-test to check whether a batch matches a certified reference value, and the two-sample test to compare instruments on the same material.
Checking homework and coursework
Students verify hand-computed t statistics and p-values; instructors show how changing one data point moves t, df, and the interval. For pass-versus-fail outcomes, reach for the Chi-Square Calculator instead.
Best Practices
- Check assumptions first. Skim the data for normality and outliers; the Statistics Calculator gives the summary numbers.
- Report effect size, not just p. Quote Cohen's d and the interval so readers can judge practical importance.
- Plan sample size before collecting. The Sample Size Calculator prevents underpowered tests.
- Prefer paired when pairing exists — matched measurements remove noise for free.
- Fix alpha and the hypothesis before looking at data — re-rolling until something is significant is how coincidence gets published.
- Match the test to the data. t-tests compare means; counts and proportions belong to the Chi-Square Calculator.
Run Your First t-test in Under a Minute
Open the T-Test Calculator, paste two short lists of numbers, and read the verdict — t statistic, p-value, effect size, and interval, computed on your device. Next time someone asks whether the difference is real, you will have the standard answer.
Related Tools You Might Like:
- Sample Size Calculator — how many observations each group needs
- Statistics Calculator — explore means, medians, and standard deviations
- Chi-Square Calculator — test associations between categorical outcomes
Happy analyzing — may your p-values be small and your effects large!
Frequently Asked Questions
Q: When should I use a t-test instead of a z-test?
A: Use the t-test whenever the population standard deviation is unknown — almost always with real data. It accounts for the uncertainty of estimating spread from the sample, and converges to the z-test as samples grow.
Q: What does a p-value of 0.03 actually mean?
A: If there were truly no difference, random sampling alone would produce a difference this large about 3% of the time. It does not mean the null hypothesis is 3% likely, or the effect large.
Q: Welch or Student's t-test — which one should I choose?
A: Student's classic test assumes both groups share the same variance. Welch drops that assumption and is the safer default, especially with unequal group sizes; when variances match, the two agree.
Q: Is my data uploaded anywhere?
A: No. Everything runs in your browser; no values or results are sent anywhere. Disconnect after the page loads and keep testing.