Thread Pool Size Calculator: Size Executors with N = Cores × (1 + W/C)
Use the Thread Pool Size Calculator to size thread pools from CPU cores and your task wait/compute ratio, with IO-bound and CPU-bound presets and copy-paste executor configs.
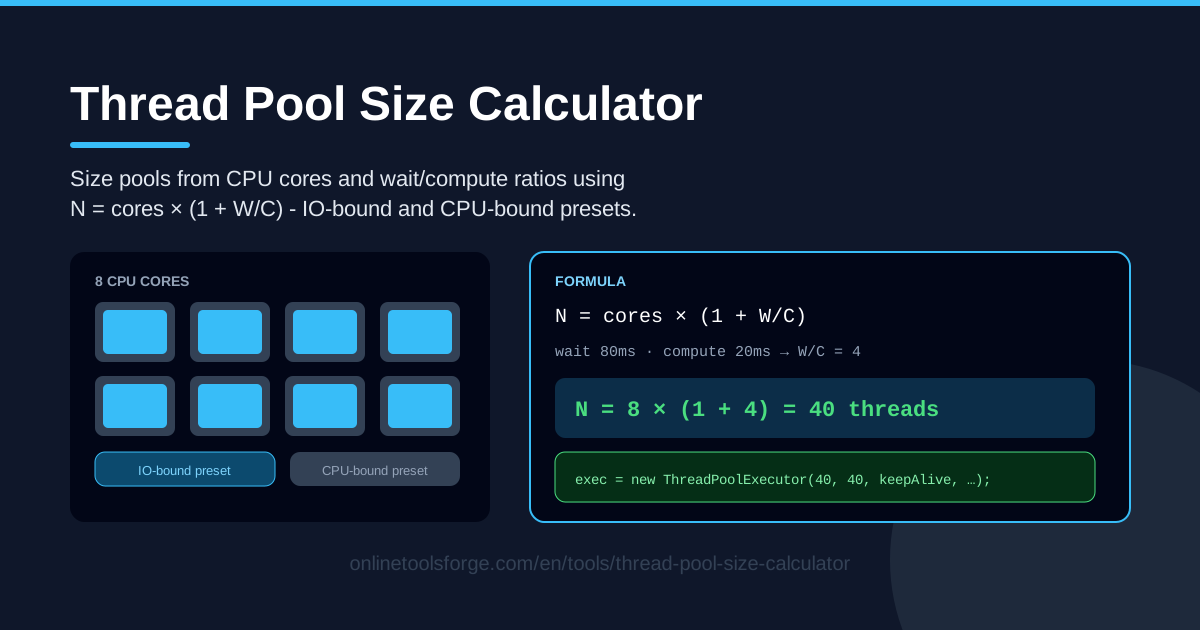
Table of Contents
Every backend engineer eventually meets the same awkward question: how many threads should this pool actually have? Set it too low and CPUs idle while requests pile up in a queue. Set it too high and you pay for thread stacks in memory while the operating system burns cycles on context switches instead of real work. The Thread Pool Size Calculator turns that guesswork into a number you can defend, sizing your pool from CPU core count and your tasks' wait-to-compute ratio using the classic N = cores × (1 + W/C) formula.
The tool runs entirely in the browser — no signup, no data leaving your machine. Enter your core count, enter how a typical task splits its time between waiting and computing, and it returns a recommended pool size for both IO-bound and CPU-bound workloads, complete with copy-paste executor configuration snippets you can drop straight into your project.
This guide walks through the calculator step by step, builds intuition for the formula behind it, and tours the situations where it saves the most time.
Why Use Thread Pool Size Calculator?
- Stop guessing thread counts. Magic numbers copied from blog posts rarely match your hardware or workload. This one is computed from your own core count and task profile.
- Built on a proven formula. N = cores × (1 + W/C) has tuned production systems for decades, balancing the two jobs of a pool: keeping cores busy and covering wait time.
- IO-bound and CPU-bound presets. Don't know your exact ratio yet? One click gives a sensible starting point for either workload shape.
- Copy-paste executor config. Ready-to-use configuration snippets turn the number into running code in seconds.
- Runs in the browser. No install, no account, no telemetry. Open the page, get the number, close the tab.
- Catches classic mistakes early. Oversized pools and unbounded queues are painful to discover under load; a principled starting value shortens every tuning session.
Key Features
The tool is deliberately small, but every input maps to a real sizing decision:
| Feature | What it does |
|---|---|
| CPU core count input | Baseline sizing from your server, VM, or container's cores. |
| Wait/compute ratio input | Captures how a task splits time between waiting (W) on IO and computing (C) on the CPU. |
| Formula-based output | Applies N = cores × (1 + W/C) instantly. |
| IO-bound preset | For tasks that mostly wait; yields a larger pool. |
| CPU-bound preset | For compute-heavy tasks; yields a pool near the core count. |
| Executor config snippets | Copy-paste configuration for your pool. |
| Browser-based execution | All computation is client-side, instant and private. |
Three details make it especially practical:
- The ratio input accepts decimals: a task that waits 80 ms and computes 20 ms is simply W/C = 4.
- Results update live as you switch presets or adjust values, so scenarios are easy to compare side by side.
- The generated snippets include a named thread factory, which pays off more in debugging than most people expect.
How to Use Thread Pool Size Calculator
- Enter your CPU core count. Use the cores actually available to your process — in a container, that is the CPU limit, not the host's total.
- Measure or estimate the wait versus compute split. Pull W and C from a profiler, APM trace, or timing logs; even a rough estimate beats a blind guess.
- Pick a preset: IO-bound or CPU-bound. Choose IO-bound when tasks mostly wait on network, disk, or databases; CPU-bound when they mostly calculate — or type your W/C value manually.
- Read the recommended pool size N. Treat it as a starting point, round it sensibly, and note the assumptions behind it.
- Copy the executor configuration. Paste the snippet, run your load tests, and adjust from measured evidence rather than folklore.
The Little Formula That Tuned a Thousand Servers
Why does something as simple as N = cores × (1 + W/C) work at all? Start with the failures it prevents. Too few threads and CPUs sit idle: each worker blocks on a socket or a database cursor, cores run at twenty percent, and latency climbs while the machine looks half asleep. Too many threads and the problem inverts: the kernel spends a visible slice of every second saving and restoring contexts, caches get evicted by constant switching, and every thread's stack consumes memory — roughly a megabyte by default in Java — so a pool of 500 threads can quietly cost half a gigabyte before doing useful work.
The formula threads the needle. A single thread spends only a fraction of its life computing; the rest it waits. To keep all cores busy you need enough threads that the compute portions of some overlap the waits of others. N = cores × (1 + W/C) is exactly that count: one "always computing" thread per core, plus W/C extra threads to cover the waiting ones.
The two presets are convenient extremes of the same idea. An IO-bound task that waits 90 ms and computes 10 ms has W/C = 9, so an 8-core machine lands near 80 threads — waits dominate, and threads are cheap insurance against idle cores. A CPU-bound task with W near zero collapses the formula to N ≈ cores, because threads beyond the core count can only take turns, adding switching overhead without throughput. IO-bound threads and CPU-bound threads: same formula, opposite ends.
Know where it breaks. It assumes memory is not a constraint; with one-megabyte stacks, a computed 400 threads means real RAM, so memory-tight containers need smaller pools or smaller stacks. It assumes your threads can actually run; if a downstream API caps concurrency at 30, sizing a pool to 200 just builds a longer line inside your own process. Locks and shared caches can cap effective parallelism too. And it is only as honest as your measurements: W and C must come from traces or timing logs of real tasks — ideally at p50 and p95, not from how slow the demo felt. Measure, recompute, and treat the output as a strong hypothesis that load testing will confirm or correct.
Practical Use Cases
Sizing an API Server Executor
Your service runs on an 8-core instance, and each request handler calls a downstream API: 80 ms waiting, 20 ms of real work, so W/C = 4. The calculator gives N = 8 × (1 + 4) = 40 threads. Put that in a fixed pool with a bounded queue, load test, and you have a defensible baseline instead of a magic 200.
Tuning Batch Job Workers
A nightly job converts and compresses uploaded media. Profiling shows 5 ms of IO against 95 ms of pure computation, so W/C ≈ 0.05 and the CPU-bound preset returns 8 — barely more than the cores available. The queue becomes the buffer between file pickup and processing.
A Database Connection Pool Sanity Check
Suppose the formula says your request pool should hold 60 threads, but your database connection pool caps at 20 connections. At peak, 40 threads will queue waiting for a connection. Widen the pool, shrink the executor, or trim per-request queries — either way, you see the conflict before production does.
Load-Test Tuning
Use the computed size as round one of a load test. Ramp traffic while watching throughput, p99 latency, CPU, and context-switch rates, then move the pool in ten percent steps. The formula lands you in the right neighborhood in one iteration instead of ten.
Best Practices
- Load test to verify. The formula is a hypothesis; only measured throughput and latency under realistic traffic confirm it.
- Name your threads. A thread factory with a descriptive prefix turns mysterious thread dumps into five-second diagnoses.
- Set sane queue bounds. Unbounded queues hide overload until memory dies; bounded queues with a clear rejection policy fail fast and visibly.
- Revisit when task profiles change. A new downstream dependency or heavier query shifts W/C — recompute when the workload changes, not once a year.
- Watch memory alongside CPU. Every thread carries a stack; check the computed size fits your container limits.
- Keep pools single-purpose. Mixing fast requests with slow bulk jobs lets the slow starve the fast; size separate pools instead.
The next time someone asks "how many threads?", answer with arithmetic instead of anecdote. Open the Thread Pool Size Calculator, enter your cores and wait-to-compute ratio, grab the executor config, and prove it with a load test. Two minutes in the browser turns one of concurrency's oldest arguments into a settled number.
Related Tools You Might Like:
Happy tuning!
Frequently Asked Questions
Q: What does the formula N = cores × (1 + W/C) actually mean? A: It counts the threads needed to keep every core busy when each thread spends part of its life waiting. W is the average time a task waits on IO, C is the time it computes, and the ratio W/C says how many waiting threads each actively computing thread needs to cover.
Q: How do I know if my workload is IO-bound or CPU-bound? A: Profile a representative task and compare waiting time to computing time. Database calls, HTTP requests, and file reads point to IO-bound; parsing, hashing, and math point to CPU-bound. If you cannot measure yet, the presets are a fair first approximation.
Q: Should I set my pool to exactly the calculated N? A: Treat it as a strong starting point. Round it sensibly, respect memory limits and downstream concurrency caps, then load test and adjust in small steps based on latency and CPU behavior.
Q: Does this only apply to Java executors? A: No. The math is language-agnostic — it works for thread pools in .NET, Python, and Go, and even informs database connection sizing. The calculator emits executor config snippets simply because Java makes them easy to paste.