Trace Context Parser: Decode and Validate W3C traceparent Headers in Seconds
Trace Context Parser breaks down and validates W3C traceparent headers — version, trace ID, parent span ID, and flags — right in your browser, with sampled-bit decoding and tracestate member checks.
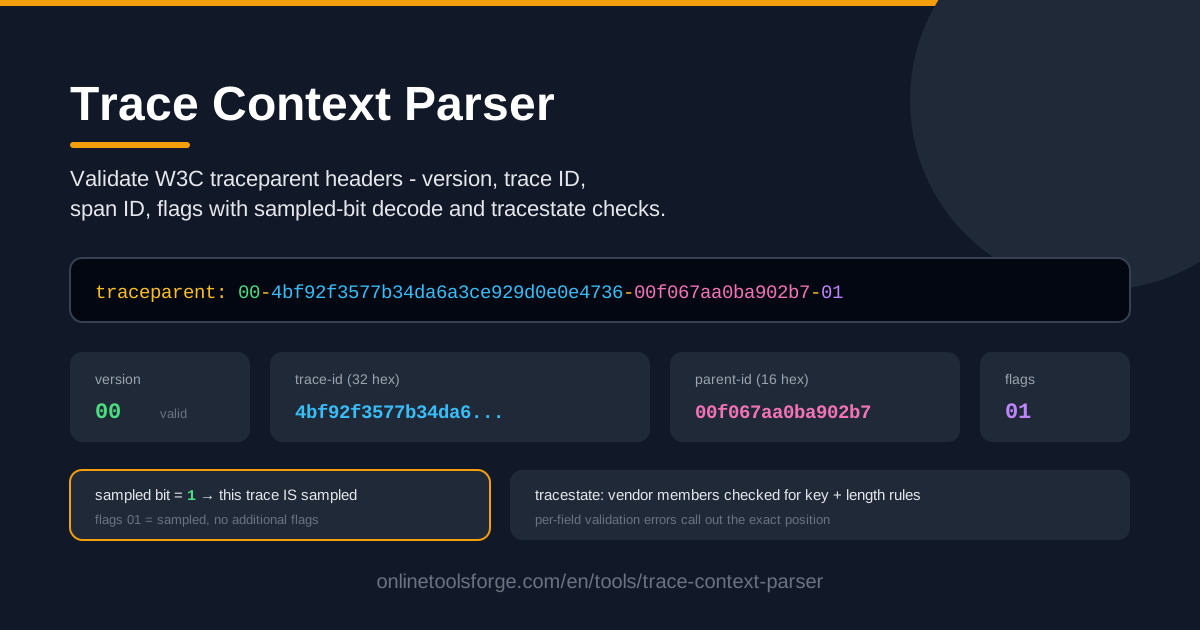
Table of Contents
Distributed tracing only works when every service along a request path agrees on the same identifiers, and in modern systems those identifiers travel in the traceparent header defined by the W3C Trace Context specification. When something goes wrong — a span goes missing, a trace ends halfway through a request, or you see two traces where you expected one — the fastest way to start debugging is to look inside that header. The Trace Context Parser makes that effortless: paste a traceparent string such as 00-4bf92f3577b34da6a3ce929d0e0e4736-00f067aa0ba902b7-01 and it instantly splits the value into version, trace ID, parent span ID, and flags, validating every field along the way.
Instead of counting hexadecimal characters by hand or guessing whether flags 01 means the trace was sampled, you get a clear verdict for each field. The parser also decodes the sampled bit and checks tracestate list members against the specification's key and length rules. And because everything runs in your browser, sensitive trace IDs and telemetry metadata never leave your machine — there is no server, no upload, and no account.
This guide walks through the tool step by step, dissects the anatomy of the traceparent header, and shares practical patterns for debugging distributed tracing in real systems, whether you run OpenTelemetry, a vendor SDK, or hand-rolled instrumentation.
Why Use Trace Context Parser?
- Instant field-by-field breakdown. The tool separates the four components of the traceparent header and labels each one, so you can see at a glance which part carries the trace ID and which part carries the flags.
- Strict validation against the specification. Each field is checked against the W3C grammar — the version must be valid, the trace ID must be 32 hexadecimal characters, the parent ID must be 16 hexadecimal characters, and neither identifier may be all zeros. Errors are reported per field, so you know exactly what is wrong rather than just "invalid header".
- Sampled-bit decoding without mental hex math. The flags field is only two hex characters, but deciding whether a trace was sampled requires knowing that the lowest bit is the sampled flag. The tool tells you directly: flags 01 means sampled, flags 00 means not sampled.
- tracestate sanity checks. If your stack also sends a tracestate header, the parser checks its list members against key-format and length rules, catching malformed vendor entries that can silently break propagation.
- Runs entirely in your browser. All parsing and validation happen locally, which matters when you are pasting trace context copied from production traffic or internal systems.
- Zero setup. No SDKs to install, no configuration, no login. Open the page, paste, read the result, move on.
Key Features
| Feature | What it does |
|---|---|
| Version parsing | Extracts and validates the leading version field, including rejection of forbidden values such as ff. |
| Trace ID parsing | Isolates the 32-character hexadecimal trace ID and validates its format and non-zero constraint. |
| Parent span ID parsing | Extracts the 16-character hexadecimal parent ID that links this header back to the span that produced it. |
| Flags parsing | Decodes the 2-character hexadecimal flags field and highlights the sampled bit. |
| Per-field validation | Reports a specific error for any field that violates the W3C grammar, so debugging is precise rather than guesswork. |
| Sampled-bit decode | States in plain language whether flags 01 means the trace was sampled and should be recorded downstream. |
| tracestate member checks | Validates tracestate list members against the key and length rules. |
| In-browser execution | Every calculation happens client-side; nothing is transmitted or logged. |
- Works with any instrumentation stack. Because traceparent is a standard, the parser is equally useful for OpenTelemetry, proprietary agent SDKs, service meshes, and hand-written propagators.
- Built for copy-paste debugging. The workflow matches how engineers actually investigate issues: grab a header from DevTools, a proxy capture, or a log line, and inspect it immediately.
- Educational by design. Each parsed field comes with enough context that developers new to distributed tracing can learn the specification while fixing a live issue.
How to Use Trace Context Parser
- Copy the traceparent header from a request. Open your browser DevTools network tab, a proxy capture, or your server access logs, and copy the full value of the traceparent header — for example 00-4bf92f3577b34da6a3ce929d0e0e4736-00f067aa0ba902b7-01.
- Paste it into the parser. Open Trace Context Parser and drop the string into the input. Parsing happens as you paste — there is no submit button to hunt for.
- Review the parsed fields. The tool displays the version, the 32-character trace ID, the 16-character parent span ID, and the flags as separate labeled pieces, each with its own validation status.
- Check the sampled bit. Read the flags decode: 01 means the trace was marked as sampled and downstream services should record it, while 00 means the caller decided not to record this trace.
- Validate tracestate. If the request also carries a tracestate header, paste it too and confirm that every list member passes the key and length checks, with no duplicate or oversized entries.
Five steps, a few seconds, and you know whether the problem lives in the header itself or somewhere downstream.
Inside the W3C Traceparent Header
A traceparent value consists of four dash-separated fields in the order version, trace ID, parent ID, and flags. Take the example 00-4bf92f3577b34da6a3ce929d0e0e4736-00f067aa0ba902b7-01 apart:
- Version — 00. The spec version of the format. Version 00 is what virtually every implementation emits today; ff is forbidden, and higher versions may extend the layout.
- Trace ID — 4bf92f3577b34da6a3ce929d0e0e4736. Exactly 32 hexadecimal characters (16 bytes) identifying the end-to-end trace. It must not be all zeros: 00000000000000000000000000000000 is invalid.
- Parent ID — 00f067aa0ba902b7. Exactly 16 hexadecimal characters (8 bytes) identifying the span that created this outgoing header. All zeros are invalid here as well.
- Flags — 01. Two hex characters representing eight bits. The lowest bit is the sampled flag: 01 means the caller has made a recording decision and downstream services should sample the trace; 00 means it should not be recorded. The remaining bits are reserved and should be preserved.
The hex constraints matter because the grammar is strict: for version 00 only lowercase hexadecimal characters are allowed, the complete header is exactly 55 characters long, and any deviation — an uppercase letter, a missing dash, a 31-character trace ID — makes the whole header invalid.
Alongside traceparent sits tracestate, a vendor-extension header containing a comma-separated list of members in key=value form. Its rules are equally strict: at most 32 list members, a combined size across all tracestate headers of no more than 512 bytes, case-sensitive keys built from lowercase letters, digits, underscores, hyphens, asterisks, and slashes (plus @ in multi-tenant keys), no duplicate keys, and no leading or trailing whitespace inside a member. The parser applies these key and length rules so that a slightly malformed tracestate cannot silently break your propagation chain.
Practical Use Cases
Debugging Missing Spans
When a service in the middle of a request never shows up in your trace waterfall, compare the traceparent header it received with the one it forwarded. Paste both into the parser: matching trace IDs confirm the context arrived, while a different trace ID on the outbound request reveals that some middleware replaced the context instead of propagating it. If both headers carry flags 00, the spans may simply never have been recorded.
Verifying That Instrumentation Propagates Headers
Before blaming the backend, confirm the client actually sent the header. Reproduce the call with curl -v, copy the traceparent from the output, and paste it into the parser. If the header is missing, truncated, or fails per-field validation at the very first hop, the problem lives in the client SDK or propagator configuration — not in the services behind it.
Testing Proxy and Gateway Header Handling
API gateways, load balancers, service meshes, and WAFs sometimes strip or rewrite headers they do not recognize. Send a known-good traceparent through the infrastructure and compare what arrives on the other side. A changed version, a truncated ID, or altered flags instantly shows you which hop is breaking the context chain.
Teaching Distributed Tracing
The parser doubles as a teaching aid. Students can paste example headers, flip the sampled bit between 00 and 01, deliberately corrupt a field, and read the resulting validation error. Interacting with a live parser builds intuition for the specification far faster than reading it end to end.
Best Practices
- Propagate context even when you are not sampling. The sampled bit only describes the caller's decision; downstream services still need the trace ID to join the same trace when their own sampling rules differ.
- Never rewrite trace IDs in middleware. Regenerating a trace ID splits one logical request into several unrelated traces and destroys the very correlation you built tracing for.
- Log the traceparent you received. Logging the incoming header at the edge gives you an anchor you can paste into the parser when a trace later appears incomplete.
- Keep your own tracestate entries short and spec-compliant. Respect the 32-member and 512-byte limits so your entries are not dropped or truncated by conforming implementations.
- Preserve unknown flags and members. Strip nothing silently: future spec versions may rely on bits and keys that look meaningless today.
- Check headers at the edge after every infrastructure change. A gateway or proxy update can quietly stop forwarding traceparent; a thirty-second paste into the parser catches it before your dashboards fill with broken traces.
Ready to inspect a suspicious header? Open the Trace Context Parser, paste a traceparent from your latest request, and see every field validated in real time — no install, no account, and nothing leaves your browser.
Related Tools You Might Like:
- JWT Decoder — inspect JWT headers, payloads, and claims in the same browser-only workflow.
- User Agent Parser — break down user agent strings into browser, engine, and platform details.
- Base64 Encoder — encode and decode Base64 strings and check padding on the spot.
Happy tracing!
Frequently Asked Questions
Q: What is the difference between traceparent and tracestate? A: traceparent is the primary header carrying the version, trace ID, parent span ID, and flags, while tracestate is an optional companion header where each vendor can attach its own key=value members. Both must be propagated together for vendor-specific context to survive the full request path.
Q: What does flags 01 mean in a traceparent header? A: The flags field is two hex characters, and its lowest bit is the sampled flag. 01 means the caller has decided to record the trace and downstream services should sample it too; 00 means the trace should not be recorded.
Q: Why is an all-zero trace ID invalid? A: The W3C specification reserves the all-zero value to mean "empty", so 00000000000000000000000000000000 cannot identify a trace. For the same reason, a parent span ID of all zeros is also rejected.
Q: Does the Trace Context Parser send my data anywhere? A: No. The tool runs entirely in your browser, so the headers you paste are parsed locally and are never uploaded, stored, or shared.